|
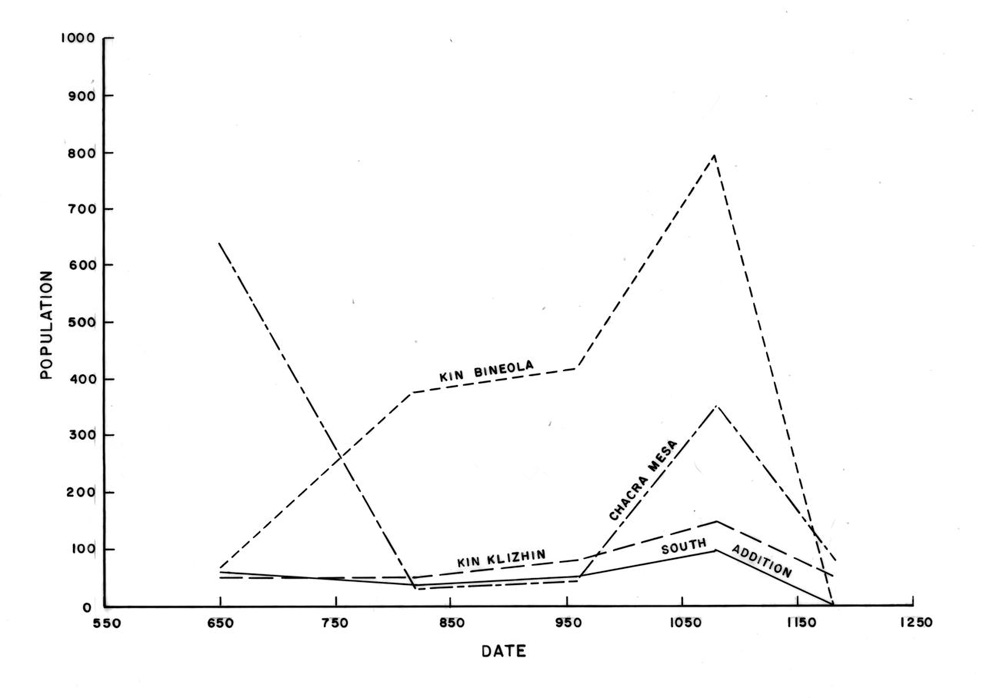
Figure 2.45. Population trends using Power + adjusted formula minus Chacoan structures. Population during each period has been plotted at the period midpoint. |
 |
|
Figure 2.45. Population trends using Power + adjusted formula minus Chacoan structures. Population during each period has been plotted at the period midpoint. |
|