|
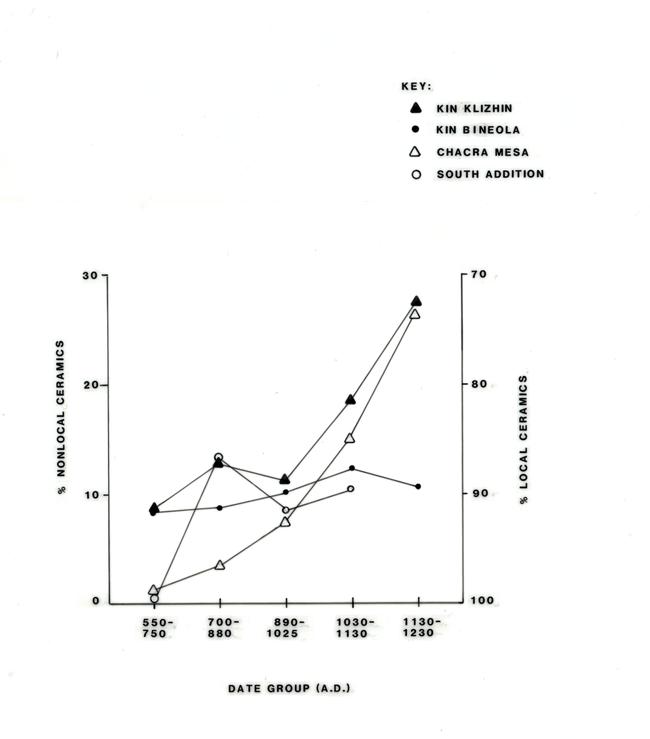
Figure 4.5. Percentage of nonlocal ceramics by date group and area as a percentage of total ceramics. |
 |
|
Figure 4.5. Percentage of nonlocal ceramics by date group and area as a percentage of total ceramics. |
|