|
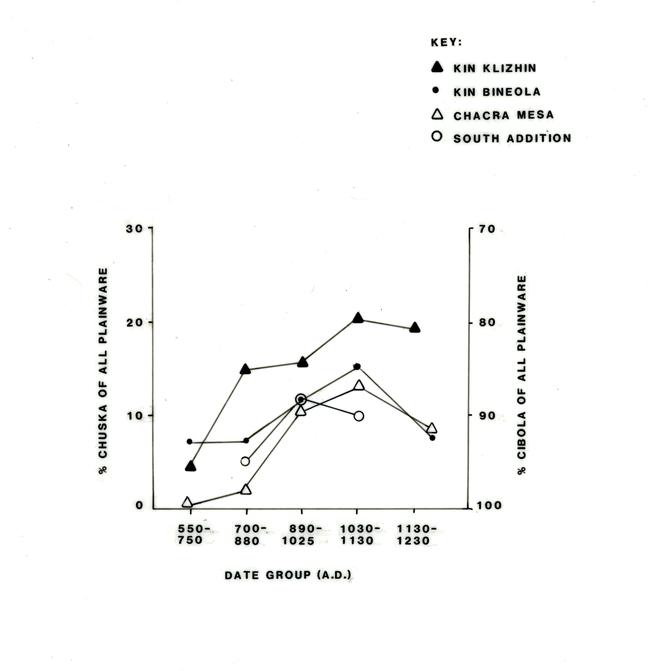
Figure 4.6. Percentage of Chuska Gray Ware and Cibola Gray Ware as a proportion of total gray ware by date group and survey area. |
 |
|
Figure 4.6. Percentage of Chuska Gray Ware and Cibola Gray Ware as a proportion of total gray ware by date group and survey area. |
|