|
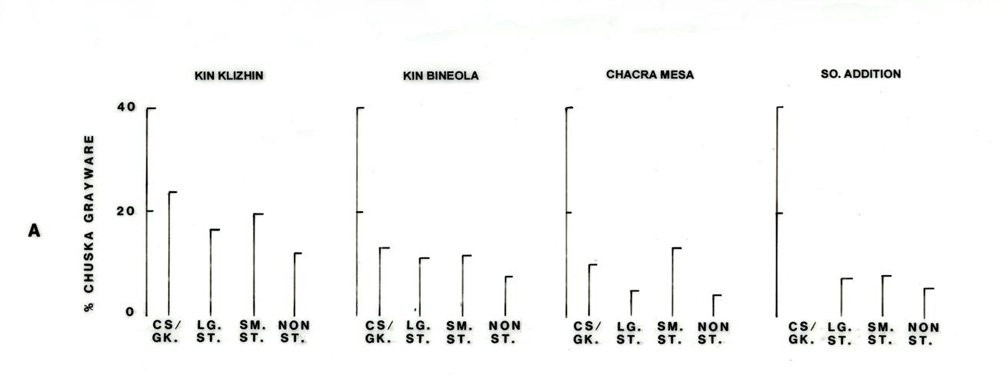
Figure 4.9a. Bar graph of percentage of Chuska Gray Ware in plain ware assemblages by area and site type group. |
 |
|
Figure 4.9a. Bar graph of percentage of Chuska Gray Ware in plain ware assemblages by area and site type group. |
|