Previous | Table of Contents | Next
5.
Lithic Procurement and Technology of the Chaco Additions Survey
Catherine M. Cameron and Lisa C. Young
¶ 1 A total of 25,515 lithic items (including chipped stone, groundstone, stone ornaments, and minerals) were subjected to in-field analysis at 569 sites and 951 proveniences in the inventory survey area. The analysis documented chipped stone raw material use in the survey areas and identified basic flaked and groundstone tool types. Spatial and temporal variability in material and artifact type frequencies are used here to examine raw material procurement and change in lithic technology through time. This chapter was written in 1985 and 1986 and underwent minor revision by the authors in 1999. It consists of three sections. The first section describes the spatial and temporal distribution of the lithic database. The second section describes patterns of lithic material selection, especially for chipped stone from Anasazi sites. The third section examines variability in the technology of lithic production and use. The first two sections were prepared by Catherine Cameron, the third by Lisa Young.
¶ 2 Supplementary to the data presented in this chapter are two data files stored at the Chaco Culture National Historical Park Archives at the University of New Mexico. The first, Appendix 5.1, presents lithic counts by artifact type and material type for each provenience recorded during the survey . The second data file, not currently available electronically, presents summarized lithic data for each provenience (ID), including the total frequency of lithics, lithic densities, site type, and proportions of lithic artifacts and materials types. It also includes ceramic data and temporal assignments made on the basis of ceramic types present in the assemblage.
¶ 3 Over 90 percent of the lithics examined during the inventory survey were chipped stone (Table 5.1). Groundstone, hammerstones, and minerals were found in low frequencies; ornaments and other tools were recorded very infrequently. Relative frequencies of artifact types were similar between cultural groups, although no ornaments were found at Archaic sites. Much of the discussion in the sections on material selection and lithic technology centers on chipped stone from Anasazi sites, as this material constitutes nearly 70 percent of the sample.
Table 5.1. Lithic artifacts by gross artifact type and cultural group.
Field Recording Procedures
¶ 4 Lithic data were recorded in the field using recording procedures which had been developed by the Chaco Project research staff for the analysis of excavated material from Chaco Canyon (Cameron 1997). Artifacts were first identified as either debitage or tools. Debitage was recorded by material type (Appendix 5.2) and by flake type (primary, secondary, biface thinning, flake fragment, or angular debris) (Appendix 5.3). The identification of material type was based on the system developed by Warren (n.d.) and is described in greater detail in Appendix 5.2. Debitage types were differentiated by presence or absence of dorsal cortex, dorsal flake scars, flake size, and configuration of the platform. These categories were aimed at the identification of three basic stages in the process of chipped stone reduction: primary core reduction, secondary reduction, and biface production.
¶ 5 Tools were classified using standard morphological criteria (Appendix 5.4) into chipped stone types (utilized or retouched flakes, facially flaked tools such as bifaces and projectile points, and hammerstones and choppers), or groundstone types (manos, metates, etc.). Minerals and ornaments were also recorded. Material type was recorded for each tool, mineral, or ornament.
Spatial and Temporal Frameworks
Hierarchy of Spatial Units
¶ 6 Proveniencing for lithics recorded during the survey is hierarchical. The most inclusive level consists of the four survey areas: Kin Klizhin, Kin Bineola, Chacra Mesa, and the South Addition. The next level is the site which includes all lithics recorded under one site number, but which may include material of different cultures or time periods. There were 569 sites with lithics. Within the site were components, which were that portion of the site assigned to the same culture and site type. There were 621 site components with lithics. The finest level is the provenience, which consists of lithics recorded at a single feature. There may be one or several proveniences within a site or component. There were 951 proveniences with lithics, and lithics within each provenience were identified by the associated deposit type as occurring in: 1) general site scatter, 2) a formal trash mound, or 3) architectural space.
Spatial Sampling
¶ 7 Of the 951 proveniences with lithics, almost all were sampled at the 100 percent level (i.e., every lithic observed was recorded). Only 67 proveniences (7 percent of the total) were sampled at less than 100 percent (Table 5.2) and the sampling fraction for these proveniences ranged from less than 0.1 percent to 99 percent of the total provenience area. Most of these had a sampling fraction of less than 40 percent. See Chapter 1, “In Field Artifact Analysis” for a description of the sampling procedure.
Table 5.2. List of proveniences sampled at less than 100 percent of total area of provenience, with sampling fraction.
Cultural Affiliation
¶ 8 Lithics recorded during the survey were associated with three cultural groups: Archaic, Anasazi, and Navajo (only four lithic artifacts were associated with Historic Anglo occupations). The distribution of the lithic sample by cultural affiliation can be examined both as the proportion of the total number of site components of each cultural type and as the proportion of the total number of lithics of each cultural type (Table 5.3).
Table 5.3. Distribution of all lithic site components, proveniences, and artifacts by culture and survey area.
¶ 9 Almost 75 percent of the lithics (n=19,077) were recorded at Anasazi components, while less than 4 percent of the lithics were recorded at Navajo components, and only 2 percent at Archaic components. The remaining 20 percent of the lithics were recorded at components of ambiguous or unknown cultural affiliation.
¶ 10 The proportion of site components with lithics of each cultural classification was similar: 68 percent of the components were Anasazi, 10 percent Navajo, 2 percent Archaic, and 20 percent Other/Unknown. The proportion of components recorded as Navajo is slightly larger than the total number of lithics recorded at these components, indicating lower average artifact densities at Navajo sites. The components recorded as Other/Unknown consisted primarily of lithic scatters without associated sherds or other temporally diagnostic artifacts. As discussed below, most of these unaffiliated lithic scatters were found on Chacra Mesa and may represent either transitory or functionally specific use of this area by any of these cultural groups.
Distribution of Site Components by Culture and Area
¶ 11 The distribution of the lithic sample by survey area indicates that only Chacra Mesa differs in the cultural composition of the sample of lithic components (Table 5.3). At Kin Klizhin, Kin Bineola, and the South Addition, between 85 percent and 97 percent of the components and more than 91 percent of the lithic artifacts in each area were associated with the Anasazi occupation. In contrast, on Chacra Mesa, 30 percent of the components and 35 percent of the artifacts were designated as Other/Unknown. Chacra Mesa also had the majority of the Navajo components and lithics, although they made up only a small proportion of the sites (14 percent) and artifacts (7 percent) on Chacra Mesa. Archaic components comprised only a small proportion of all sites and artifacts and they were recorded in only two survey areas, Kin Klizhin and Chacra Mesa.
Distribution of Site and Feature Types by Culture
¶ 12 Site types were generally associated with only one cultural group (Table 5.4). Seventy-five percent of the Archaic components with lithics were camps or camp-like sites. Habitations were the most common (31 percent) Anasazi site type, consisting of structural sites of three rooms or more. Another 20 percent of the Anasazi components were nonstructural camp-like sites. Small structural components (including fieldhouses, ledgerooms, and fieldhouse/habitation sites) comprised almost 22 percent of the Anasazi components, while the remainder of the Anasazi components were of a wide variety of types. More than half of the Navajo components were hogans and most of the rest consisted of a variety of nonstructural types (camps, hearths, artifact scatters, etc.). Components in the Other/Unknown category were primarily nonstructural, almost half camp-like sites.
|
Table 5.4. Distribution of all lithic site components by site type and culture. |
||||||||||
|---|---|---|---|---|---|---|---|---|---|---|
| Culture | ||||||||||
| Archaic | Anasazi | Navajo | Other | Total | ||||||
| Site Type | No. | % | No. | % | No. | % | No. | % | No. | % |
| Habitation | - | - | 130 | 99.23 | - | - | 1 | 0.76 | 131 | 100.0 |
| Fieldhouse | - | - | 64 | 94.11 | 1 | 1.47 | 3 | 4.41 | 68 | 100.0 |
| Ledgeroom | - | - | 24 | 96.00 | - | - | 1 | 4.00 | 25 | 100.0 |
| Sherd Scatter | - | - | 20 | 95.24 | - | - | 1 | 4.76 | 21 | 100.0 |
| Sherd/Lithic Scatter | - | - | 14 | 77.78 | 2 | 11.11 | 2 | 11.11 | 18 | 100.0 |
| Camp | 8 | 36.36 | 1 | 4.54 | 9 | 40.91 | 4 | 18.18 | 22 | 100.0 |
| Hearth | - | - | 9 | 69.23 | 2 | 15.38 | 2 | 15.38 | 13 | 100.0 |
| Baking Pit | 1 | 4.17 | 18 | 75.00 | - | - | 5 | 20.83 | 24 | 100.0 |
| Water Control | - | - | 6 | 85.71 | - | - | 1 | 14.28 | 7 | 100.0 |
| Cist/Storage | - | - | 2 | 33.33 | 3 | 50.00 | 1 | 16.67 | 6 | 100.0 |
| Shrine | - | - | 9 | 90.00 | - | - | 1 | 10.00 | 10 | 100.0 |
| Great Kiva/Habitation | - | - | 1 | 100.0 | - | - | - | - | 1 | 100.0 |
| Sweat Lodge | - | - | - | - | 1 | 100.0 | - | - | 1 | 100.0 |
| Fieldhouse/Habitation | - | - | 5 | 100.0 | - | - | - | - | 5 | 100.0 |
| Hogan | - | - | 3 | 6.38 | 32 | 68.08 | 12 | 25.53 | 47 | 100.0 |
| Chacoan Structure | - | - | 5 | 100.0 | - | - | - | - | 5 | 100.0 |
| Camp-like Site | 1 | 0.67 | 86 | 56.95 | 1 | 0.66 | 63 | 41.72 | 151 | 100.0 |
| Lithic Scatter | 1 | 7.69 | 1 | 7.69 | - | - | 11 | 84.62 | 13 | 100.0 |
| Road Segment/Trail | - | - | 13 | 72.22 | 3 | 16.67 | 2 | 11.11 | 18 | 100.0 |
| Great Kiva (Isolated) | - | - | 1 | 100.0 | - | - | - | - | 1 | 100.0 |
| Rock Art | - | - | 1 | 14.29 | - | - | 6 | 85.71 | 7 | 100.0 |
| Stairs | - | - | 1 | 50.00 | - | - | 1 | 50.00 | 2 | 100.0 |
| Animal Husbandry | - | - | - | - | 2 | 100.0 | - | - | 2 | 100.0 |
| Other | 1 | 7.7 | 2 | 15.38 | 1 | 7.7 | 9 | 69.23 | 13 | 100.0 |
| Unknown Navajo | - | - | - | - | 2 | 100.0 | - | - | 2 | 100.0 |
| Unknown Anasazi | - | - | 4 | 80.00 | - | - | 1 | 20.00 | 5 | 100.0 |
| Total | 12 | 1.94 | 420 | 67.96 | 59 | 9.54 | 127 | 20.55 | 618 | 100.0 |
¶ 13 Feature types also tended to be associated with only one cultural type, although artifact scatters were common feature types in all cultures (Table 5.5). Trends noted in feature type distributions are very similar to those described for site types: Archaic and Other/Unknown features are primarily nonstructural while structures tend to occur at Anasazi sites.
|
Table 5.5. Distribution of all lithic site proveniences by feature type and culture. |
||||||||||
|---|---|---|---|---|---|---|---|---|---|---|
| Culture | ||||||||||
| Archaic | Anasazi | Navajo | Other | Total | ||||||
| Site Type | No. | % | No. | % | No. | % | No. | % | No. | % |
| Roomblock | - | - | 156 | 100.0 | - | - | - | - | 156 | 100.0 |
| Fieldhouse | - | - | 76 | 97.43 | 1 | 1.28 | 1 | 1.28 | 78 | 100.0 |
| Ledgeroom | - | - | 27 | 100.0 | - | - | - | - | 27 | 100.0 |
| Sherd Scatter | - | - | 53 | 94.64 | 1 | 1.79 | 2 | 3.57 | 56 | 100.0 |
| Sherd/Lithic Scatter | - | - | 42 | 82.35 | 2 | 3.92 | 7 | 13.73 | 51 | 100.0 |
| Lithic Scatter | 6 | 9.68 | 15 | 24.19 | 4 | 6.45 | 37 | 59.68 | 62 | 100.0 |
| Camp | - | - | - | - | 1 | 100.0 | - | - | 1 | 100.0 |
| Hearth | - | - | 24 | 80.00 | 3 | 10.00 | 3 | 10.00 | 30 | 100.0 |
| Baking Pit | 1 | 3.45 | 22 | 75.86 | - | - | 6 | 20.69 | 29 | 100.0 |
| Cist | - | - | 3 | 60.00 | - | - | 2 | 40.00 | 5 | 100.0 |
| Storage Room | - | - | 1 | 33.33 | 2 | 66.66 | - | - | 3 | 100.0 |
| Shrine | - | - | 7 | 87.50 | - | - | 1 | 12.50 | 8 | 100.0 |
| Great Kiva | - | - | 4 | 100.0 | - | - | - | - | 4 | 100.0 |
| Hogan | - | - | - | - | 34 | 79.07 | 9 | 20.93 | 43 | 100.0 |
| Sweat Lodge | - | - | - | - | 2 | 100.0 | - | - | 2 | 100.0 |
| Chacoan Structure | - | - | 20 | 100.0 | - | - | - | - | 20 | 100.0 |
| Trail | - | - | 3 | 100.0 | - | - | - | - | 3 | 100.0 |
| Rock Art | - | - | - | - | - | - | 1 | 100.0 | 1 | 100.0 |
| Stairs | - | - | 1 | 50.0 | - | - | 1 | 50.0 | 2 | 100.0 |
| Slab/Fire Cracked Rock | 1 | 3.03 | 21 | 63.64 | 7 | 21.21 | 4 | 12.12 | 33 | 100.0 |
| Kiva | - | - | 1 | 100.0 | - | - | - | - | 1 | 100.0 |
| Fieldhouse/Water Control | - | - | 2 | 100.0 | - | - | - | - | 2 | 100.0 |
| Lithic Concentration | - | - | 10 | 34.48 | 2 | 6.90 | 17 | 58.62 | 29 | 100.0 |
| Pot Drop | - | - | 2 | 66.67 | 1 | 33.33 | - | - | 3 | 100.0 |
| Unknown Structure | - | - | 12 | 80.00 | 2 | 13.33 | 1 | 6.67 | 15 | 100.0 |
| Unknown Feature | - | - | 1 | 100.0 | - | - | - | - | 1 | 100.0 |
| Corral | - | - | - | - | 1 | 100.0 | - | - | 1 | 100.0 |
| Check Dam | - | - | 1 | 100.0 | - | - | - | - | 1 | 100.0 |
| Cairn | - | - | 4 | 100.0 | - | - | - | - | 4 | 100.0 |
| Ramada/Lean-to | - | - | 1 | 100.0 | - | - | - | - | 1 | 100.0 |
| General Site Scatter | 1 | 0.46 | 109 | 50.23 | 28 | 12.90 | 79 | 36.41 | 217 | 100.0 |
| Pithouse | - | - | 45 | 100.0 | - | - | - | - | 45 | 100.0 |
| Stone Circle | - | - | 1 | 100.0 | - | - | - | - | 1 | 100.0 |
| Water Control | - | - | 2 | 100.0 | - | - | - | - | 2 | 100.0 |
| Rockshelter | - | - | 4 | 44.44 | 2 | 22.22 | 3 | 33.33 | 9 | 100.0 |
| Ash Heap | - | - | - | - | 1 | 100.0 | - | - | 1 | 100.0 |
| Other | 2 | 66.67 | 1 | 33.33 | - | - | - | - | 3 | 100.0 |
| Unknown | - | - | - | - | 1 | 100.0 | - | - | 1 | 100.0 |
| Total | 11 | 1.15 | 671 | 70.56 | 95 | 9.99 | 174 | 18.30 | 951 | 100.0 |
Distribution of Lithic Sample by Spatial Units
¶ 14 In the following sections, site and feature types are grouped by morphological characteristics (Tables 5.6 and 5.7) and the distribution of these groups is examined across the survey areas. As much of the following discussion centers on Anasazi material, many of the Navajo site and feature type designations have been included in the “Other” category.
|
Table 5.6. Classification of site types into site type groups. |
|
|---|---|
| Site Type Group | Site Type Members |
| Structural | |
| Large Structure | Habitation |
| Chacoan Structures/Great Kivas | Great Kiva/Habitation |
| Chacoan Structure | |
| Isolated Great Kiva | |
| Small Structures | Fieldhouse |
| Ledgeroom(s) | |
| Fieldhouse/Water Control | |
| Nonstructural | |
| Roads or Trails | Road Segment/Trail |
| Stairs | |
| Scatters | Sherd Scatter |
| Sherd/Lithic Scatter | |
| Lithic Scatter | |
| Hearths | Hearth |
| Camp-like Site | |
| Baking Pits | Baking Pit |
| Storage Features | Cist/Storage |
| Other | Camp, Water Control, Shrine, Sweat Lodge, Hogan, Rock Art, Animal Husbandry, Other, Unknown Navajo, Unknown Anasazi |
|
Table 5.7. Classification of feature types into feature type groups. |
|
|---|---|
| Feature Type Group | Feature Type Members |
| Large Structure | Roomblock |
| Kiva | |
| Chacoan Structures/Great Kivas | Great Kiva |
| Chacoan Structure | |
| Small Structures | Fieldhouse |
| Ledgeroom(s) | |
| Fieldhouse/Water Control | |
| Unknown Structure | |
| Ramada/Lean-to | |
| Artifact Scatter | SherdScatter |
| Sherd/Lithic Scatter | |
| Lithic Scatter | |
| Lithic Concentration | |
| Pot Drop | |
| General Site Scatter | |
| Hearth | Hearth |
| Baking Pit | Baking Pit |
| Storage Features | Cist |
| Storage Room | |
| Roads/Trails | Road |
| Trail | |
| Stairs | |
| Slab Scatter | Slab/Fire Cracked Rock Scatter |
| Water Control | Canal/Ditch |
| Dam | |
| Check Dam | |
| Water Control | |
| Pithouse | Pithouse |
| Shelter | Rockshelter |
| Other | Camp, Shrine, Hogan, Sweat Lodge, Rock Art, Unknown Feature, Corral, Cairn, Quarry, Burial, Stone Circle, Ash Heap, Other, Unknown |
Spatial Distribution of Site Type Groups by Survey Area
¶ 15 Chacra Mesa has by far the largest sample of site components (61 percent) and lithics (53 percent), almost three times as many as any other area (Table 5.3). The South Addition has by far the fewest. Large structures are the most common site type group at Kin Klizhin and Kin Bineola and produced more than 60 percent of the lithics in each area (Table 5.8). Small structures were slightly more frequent than large structures in the South Addition, but large structures produced more than 76 percent of the lithics in this area. Chacra Mesa is clearly different, as hearth/camps are by far the most common site type group, and this site type group is associated with the largest number of lithics. Kin Bineola diverges from the other survey areas in the large number of lithics associated with Chacoan structures (great houses1The term Chacoan structure is used throughout this chapter in place of great house.) and great kivas. While this partially reflects the greater number of Chacoan structure and great kiva components, almost half of these artifacts were recorded at the Kin Bineola site (29SJ1580) itself.
Table 5.8. Frequency of all site components and lithics by grouped site type for each survey area.
Spatial Distribution of Feature Type Groups
¶ 16 In all four survey areas, lithics are most commonly associated with three major feature type groups (Table 5.9): large structures, small structures, and artifact scatters. Large structures were most common at Kin Klizhin and Kin Bineola while artifact scatters were most common in the South Addition and on Chacra Mesa. The proportion of lithics associated with each of these areas followed the same pattern, except for the South Addition. Large structures produced the greatest number of lithics at Kin Klizhin and Kin Bineola and artifact scatters produced the greatest number of lithics on Chacra Mesa. In the South Addition, even though the greatest number of proveniences were artifact scatters, more than half of the lithics were produced by large structures. In addition, Kin Bineola showed an unusually high proportion of lithics which were associated with Chacoan structures and great kivas (again the result of the large sample recorded at the Kin Bineola site itself).
Table 5.9. Frequency of all proveniences and lithics by grouped feature type for each survey area.
Spatial Distribution of Deposit Types
¶ 17 Three deposit types were distinguished during the survey: formalized trash mounds, refuse scatters, and structures or features. The majority of the proveniences and the majority of the lithics were associated with refuse scatters at Kin Klizhin, Chacra Mesa, and the South Addition (Table 5.10). However, at Kin Bineola more than half of the lithics were recorded in formalized trash mounds.
Table 5.10. Frequency of all proveniences and lithics by deposit type for each survey area.
Temporal Variability in Anasazi Sites
¶ 18 The temporal framework selected for the analysis of the Anasazi lithic sample was the five time groups developed by Mills (Chapter 4) based on ceramic data. Mills established the time groups through a cluster analysis of beginning and ending dates assigned to each provenience based on ceramic data. Only those proveniences which could be dated within a 200 year period were included, permitting discussion of only about half the total number of proveniences and lithics (488 proveniences and 13,687 lithics). In the following section, the distribution of lithics within time groups is compared between survey areas and with associated site and feature type groups.
Temporal Variability of Anasazi Sample by Survey Area
¶ 19 The largest number of proveniences (44 percent) and lithics (36 percent) were assigned to the A.D. 1030 to 1130 time group (Table 5.11). The time group immediately preceding this one (A.D. 890 to 1025) and the earliest time group (A.D. 550 to 750) each account for about 20 percent of the proveniences and 22 percent to 25 percent of the lithics. Least well represented in the survey area are the time groups from A.D. 700 to 880 and A.D. 1130 to 1230.
Table 5.11. Temporal distribution of Anasazi proveniences and lithics by survey area.
¶ 20 The four survey areas differ in intensity of use through time as indicated by lithic data. The majority of the proveniences and lithics dating to the A.D. 550 to 750 time group were found on Chacra Mesa: almost 60 percent of the Chacra Mesa lithics dated to this period (Table 5.11). This suggests an early use of Chacra Mesa that is not apparent in the other survey areas. The time group from A.D. 700 to 880 is represented by few proveniences and lithics; however, proveniences and lithics associated with this time group are found most frequently in the Kin Bineola survey area. Because the number of proveniences and lithics from this time group is small (row totals, Table 5.11), it includes only 20 percent of the total proveniences and lithics from the Kin Bineola area.
¶ 21 As noted above, the A.D. 890 to 1025 and 1030 to 1130 time groups are well represented by both proveniences and lithics in all four survey areas. As this period (from about A.D. 900 to 1150) is the period of most extensive occupation of Chaco Canyon (Hayes 1981), the high frequency of sites and artifacts from this time group is not surprising.
¶ 22 The time group from A.D. 1130 to 1230 is the most poorly represented of the five time groups. No materials dating to this time group were found in the South Addition, and very few were identified at Kin Bineola. Components and lithics from this time group were most common at Kin Klizhin and on Chacra Mesa, although in neither area did they form a large proportion of the sample. This poor representation is undoubtedly the result of the decline of the Chaco Regional System after A.D. 1150.
Temporal Distribution of Anasazi Sample by Grouped Site and Feature Type
¶ 23 Large structures contribute a majority of the lithics through time in all survey areas, with a few notable exceptions (Table 5.12). Chacra Mesa shows the most variation. During the time groups from A.D. 700 to 880 and 890 to 1025 more than 70 percent of the lithics on Chacra Mesa are associated with hearth/camps, a nonstructural site type group most frequently consisting of a lithic scatter and few features. Lithics were not commonly associated with hearth/camps in other areas during any time group. Furthermore, almost half of the lithics in the latest time group (A.D. 1130 to 1230) on Chacra Mesa are associated with an isolated great kiva (29SJ2557). Only two sites were assigned to this group: Chacoan structure 29SJ 2384 and great kiva 29SJ 2557. The high frequency of lithics at this site is unusual as A.D. 1130 to 1230 is a period when Chacoan structures and great kivas were apparently no longer in use in the other three survey areas. Patterns of site use on Chacra Mesa during these three time groups obviously differed from those of the other survey areas.
Table 5.12. Frequency of Anasazi lithics by time group and grouped site type for each survey area.
¶ 24 At Kin Klizhin in the A.D. 1030 to 1130 time group, large structures contributed only 42 percent of the lithics, while small structures contributed 27 percent. This differs from the common pattern of more than 50 percent lithics from large structures and low frequencies from small structures. Relatively high frequencies of lithics from small structures are also found at Kin Klizhin in the A.D. 700 to 880 time group and in the South Addition in the A.D. 890 to 1025 time group. However in both of these areas, the majority of the lithics are still from large structures.
¶ 25 The association of feature type groups with time groups shows that, as with site type groups, the large structure feature type contributes the largest number of lithics during most time groups in most survey areas (Table 5.13). Chacra Mesa again shows the most variation from this trend, although differences are also apparent at Kin Klizhin and the South Addition, especially for the earliest time group (A.D. 550 to 750). During this period, artifact scatters are the most prevalent feature type group at Kin Klizhin and the South Addition, while pithouses contribute almost 70 percent of the lithics on Chacra Mesa (although almost 50 percent of these lithics were recorded at Shabik’eshchee Village). During later periods variations from the pattern are found primarily on Chacra Mesa. During the A.D. 890 to 1025 time group, artifact scatters contribute more than 80 percent of the lithics. During the final time group (A.D. 1130 to 1230) the 29SJ2557 great kiva contributes almost 50 percent of the total lithics found on Chacra Mesa.
Table 5.13. Frequency of Anasazi lithics by time group and grouped feature type for each survey area.
Lithic Artifact Density by Site and Feature Type Groups
¶ 26 Lithic density in the areas examined by the Chaco Survey Project is generally low (Table 5.14). The majority (70 percent) of the recorded site components had a lithic density of less than 0.1 artifact per square meter. In general, large structures and Chacoan structures and great kivas showed the highest densities. Lithic density is greatest for the site type group Chacoan structures and great kivas at Kin Bineola (mean density 0.71 artifact per square meter). Large structures at Kin Klizhin and storage features (which are only found on Chacra Mesa) also show comparatively high lithic densities, while other grouped site type components have very low densities (less than 0.40 artifacts per square meter). The Kin Klizhin area had the highest average density of any of the survey areas.
Table 5.14. Density of lithics (artifacts per m2 ) at all components by grouped site type and survey area.
¶ 27 The lithic density of feature type groups, because they reflect the artifact distribution of a more restricted area, are higher than those of site type groups. Densities tend to be higher for those feature type groups associated with habitation (Table 5.15). Lithic density is highest for the feature type group large structures, especially in the South Addition and Kin Klizhin areas (mean density 1.99 and 1.36 artifacts per square meter, respectively). Pithouses at Kin Klizhin also exhibited high densities of lithic artifacts (mean density 1.11 artifacts per square meter), while other feature type groups had lithic densities of less than one artifact per square meter.
Table 5.15. Density of lithics (artifacts per m2) at all proveniences by grouped feature type and survey area.
Material Selection
¶ 28 The distribution of lithic material from the inventory survey is used here to examine patterns of raw material procurement which operated at sites in the survey areas, especially those associated with the procurement of nonlocal materials. High frequencies of nonlocal material have been reported at sites in Chaco Canyon (Cameron 1984, 1997), and the occurrence of nonlocal materials at sites in the survey areas may provide an indication of the degree to which these sites were integrated into procurement and distribution systems which may have operated as part of the Chacoan Regional System.
¶ 29 Several studies have used chipped stone material to examine the role of Chaco Canyon and Chacoan outliers in the economic systems of the San Juan Basin (Cameron 1984, 1997; Jacobson 1984; Powers et al. 1983). Early hypotheses suggested that a redistribution system may have operated during the Bonito Phase (A.D. 1040/50 to 1100), with Chaco as a central point, and with distribution of goods to outliers (Judge 1979). However, studies of chipped stone and ceramic distributions at a number of outliers did not indicate the redistribution of these artifact classes from Chaco Canyon to outlier sites (Cameron 1984; Jacobson 1984; Toll 1984). A corollary of the redistribution hypothesis suggests that Chacoan outlier sites influence the distribution of goods to sites in areas surrounding the outlier. Chipped stone data from the inventory survey can be used to address this question. If Chacoan sites were controlling the procurement and distribution of nonlocal raw materials, we should expect to find higher quantities of these materials at the outliers and lower quantities at surrounding, non-Chacoan sites.
¶ 30 Periodic population aggregation in Chaco Canyon has been suggested as an alternative to the redistribution hypothesis (Judge 1989; Loose and Lyons 1976; Windes 1987). The hypothesis suggests that Chaco Canyon great houses (or Chacoan structures) were the locations of periodic religious rituals where goods were exchanged and consumed by hosts and guests from outlying Chacoan structures. Since the participants were all Chacoan structure residents, the distributions of goods among these sites should be similar. Ceramic and chipped stone data from excavated sites in Chaco Canyon provide some support for this hypothesis (Cameron 1984; Toll 1984). Data from the Pueblo Alto trash mound indicate a larger population than would be indicated by architecture alone. This evidence, coupled with high percentages of nonlocal ceramics and chipped stone materials would seem to favor the interpretation of periodic aggregation. A variation of this hypothesis can be examined in the survey areas by comparing relative frequencies of raw material types at Chacoan structures in each the survey area with relative frequencies of raw material types with large structures in the same survey area. If, for example, the residents of the Kin Klizhin Chacoan structure were hosting events attended by Chacoan structure residents from other communities, then the lithic assemblage from this site should contain higher percentages of nonlocal materials than adjacent large structures inhabited by local people. On the other hand, if the proportions of nonlocal materials at the Chacoan structure and large structures are the same, this might suggest that the periodic events held at Kin Klizhin were attended primarily by local residents whose access to nonlocal materials differed little from the residents of the Chaco structure.
¶ 31 The use of chipped stone data to address these questions assumes that chipped stone raw material used at sites in the Chaco Canyon region was obtained through a uniform and formalized procurement strategy. This may not have been the case. Chipped stone may have been procured through a wide variety of mechanisms including direct procurement and exchange. Alternatively, following Binford’s (1979) concept of an “embedded procurement strategy,” chipped stone might have been acquired only incidentally during the acquisition of other types of goods. If an embedded procurement strategy was in operation in the survey area, then we should expect to find that the most readily available local materials would be those most commonly recovered from archaeological sites. While nonlocal materials should be infrequent, those present would tend to be from sources located in areas where other sorts of economic activities were performed.
¶ 32 The following sections examine the spatial and temporal distribution of raw material types recorded at sites in the inventory survey and attempts to address the questions posed here. Of primary interest, of course, is the degree to which the survey areas participated in a Chacoan regional system, based on evidence of chipped stone material distributions.
Material Types
¶ 33 Material types are based on the lithic classification system developed by Warren (n.d.), and on modifications of this system by Cameron (1997) and by the inventory survey personnel (Appendix 5.2). Almost half of the material types recorded during the inventory survey are local silicified woods, and another third are local cherts and chalcedonies. Less than 7 percent are of nonlocal material types. Appendix 5.2 describes the material types used, the characteristics used in identifying them, and their probable sources. In the following analysis, nonlocal material types are combined into six source groups and local material types into ten source groups (Table 5.16).
Table 5.16. Classification of material types into material type groups.
Sources of Local Materials
¶ 34 Sources for most of the local chipped stone material types (Figure 5.1) recorded during the Chaco Survey are primarily north of Chaco Canyon in the Ojo Alamo, Kirtland, Fruitland, and San Jose Formations, although these materials are also found as redeposited gravels throughout the area (Love 1997). There are no sources for siliceous stone immediately south of Chaco Canyon. Sources for sandstone (from the Cliff House Sandstone Formation), baked shale, hematite, selenite, and calcite are available throughout the Chaco Canyon area.
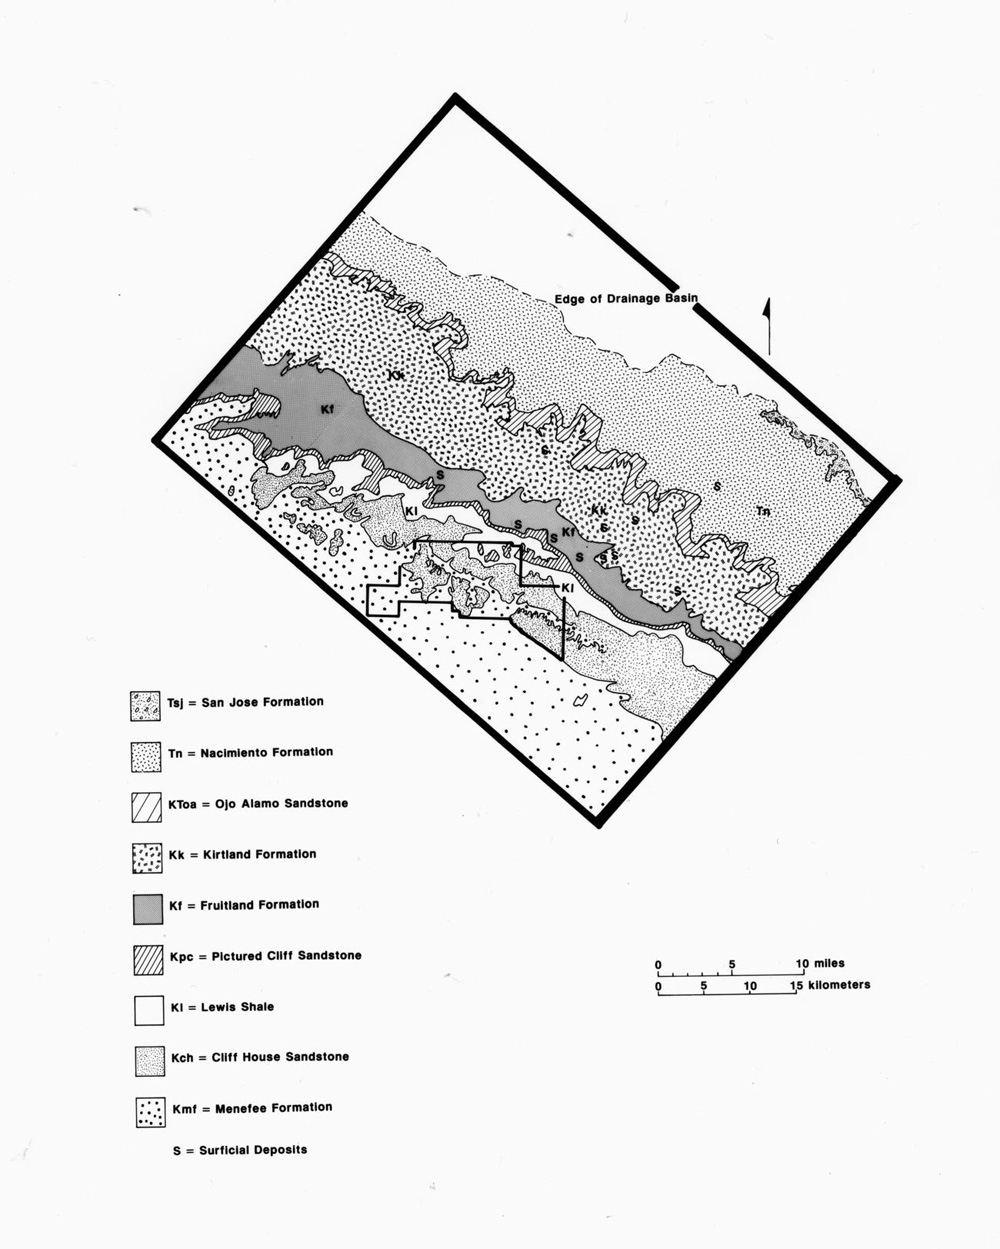 |
Figure 5.1. Geologic formations in the Chaco Canyon area containing local raw materials used for chipped and ground stone. The boundaries of Chaco Culture National Historical Park are outlined in the lower third of the map, and include the Kin Klizhin, South Addition and Chacra Mesa survey areas. The Kin Bineola survey area, located to the west of Kin Klizhin, is not shown. |
Sources of Nonlocal Materials
¶ 35 Six nonlocal chipped stone material types and a number of nonlocal minerals were recorded at sites in the inventory survey areas (Figure 5.2, see Appendix 5.2). Although exact sources have not been located for all nonlocal material, most appear to be located at distances greater than 50 km from the survey areas. As discussed below, some nonlocal materials may have come from a number of sources. These materials, as described by David Love (1997), have good flaking qualities which may have been why they were imported from considerable distances.
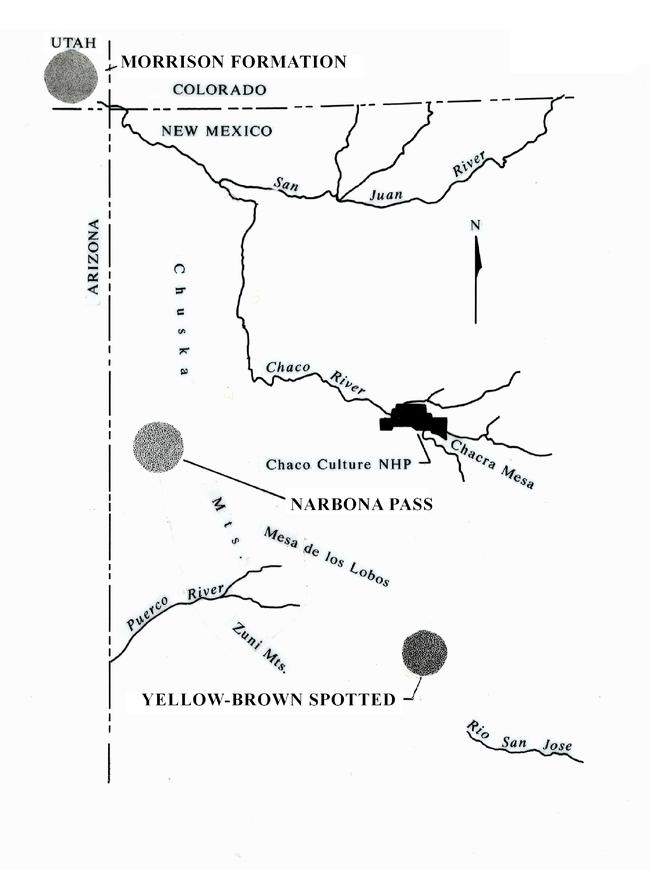 |
Figure 5.2. Source locations for nonlocal chipped stone materials found at Chaco Additions survey and Chaco Canyon sites. |
¶ 36 The Morrison Formation, which produces cherts and quartzitic sandstone (including Brushy Basin chert), outcrops over a wide area encircling the San Juan Basin at distances of more than 70 km from Chaco Canyon (Types 1020, 1022, 1040, and 1041). Usable outcrops of this material have been reported only in the Four-Corners area (Phillip Shelley, personal communication 1981), but outcrops may occur in other parts of the San Juan Basin. Sources for yellow-brown spotted chert (Type 1072) have been reported in the Zuni Mountains (possibly derived from the San Andres Formation), more than 80 km south of Chaco Canyon (Kilby 2005, LeTourneau 1997; Whitmore 1979).
¶ 37 Narbona Pass chert (Type 1080, formerly Washington Pass chert) is located in the Chuska Mountains about 80 km west of Chaco Canyon. The source for this material is specific, although some of the material may have been redeposited along drainages on the east slope of the Chuska Mountains. This material has excellent flaking qualities, as well as a lovely pink color.
¶ 38 A. H. Warren (personal communication) has suggested that Zuni Wood (Type 1160) could be found between Zuni and Ojo Caliente (on the Zuni Reservation) in Triassic rocks, possibly the Petrified Forest member of the Chinle Formation. This area is more than 140 km from the Chaco Canyon region; however, other sources for this material are possible. Obsidian could not be identified to specific source areas in the field. Obsidian from sites excavated in Chaco Canyon has been identified from 12 sources located in New Mexico, Arizona, Colorado, and Utah (Cameron and Sappington 1984). The most common sources are Jemez and Red Hill. Grants obsidian is the source located closest to the Chaco Canyon area, while other sources are all more than 100 km away. Laguna chert (Type 1430) has been identified near Laguna, New Mexico and is associated with chalcedony found in the Upper Morrison Formation (Warren n.d.). This material is very similar to Pedernal chert (Love 1997). Turquoise, azurite, and malachite are not found locally in the Chaco Canyon area. Sources for these minerals are discussed by Mathien (1997).
General Patterns in Material Selection
¶ 39 Over 70 percent of the lithic assemblage was of four local material types: chalcedonic silicified wood, miscellaneous chert/chalcedony, cherty silicified wood, and high surface chert (Table 5.16). The most common local material, chalcedonic silicified wood, is found infrequently in natural deposits in the Chaco area, which may be the result of natural processes or prehistoric selection and over collection of this material (Love 1997). At excavated sites in Chaco Canyon, chalcedonic silicified wood was frequently used to manufacture drills and has been associated with bead working activities (Cameron 1997). Miscellaneous chert/chalcedony was used as a catch-all category for materials of unusual or unknown type (Appendix 5.2).
¶ 40 Nonlocal materials make up less than 7 percent of the chipped stone recorded at survey sites (Table 5.16). Yellow-brown spotted chert and Narbona Pass chert are the most common nonlocal materials. Morrison Formation materials and obsidian are less frequent, while Zuni wood and Laguna chert are found only occasionally in the surveyed areas.
¶ 41 Material type varies with the type of tool manufactured (Table 5.17). Sixty-five percent of the groundstone is of sandstone, 44 percent of the hammerstones are of quartzite, and more than 65 percent of the minerals and ornaments are shale. Although material selection for the manufacture of chipped stone tools was not as clear cut, patterning was evident. Over 25 percent of the projectile points are of nonlocal material, primarily obsidian (20 percent). Nearly 29 percent are of miscellaneous chert/chalcedony, a catch-all category which may include unusual or unknown material types. Scrapers and bifaces were made primarily of the four most common local materials: miscellaneous chert/chalcedony, chalcedonic silicified wood, high surface chert, and cherty silicified wood. More than 40 percent of the drills were made of chalcedonic silicified wood. As noted above, this pattern is similar to that found for drills at sites in Chaco Canyon (Cameron 1997).
Table 5.17. Frequency of artifact type by material type for all lithic artifacts.
Patterns in the Distribution of Material Types at Anasazi Sites
¶ 42 This section addresses only chipped stone material from Anasazi sites, which forms the bulk of the material recorded during the Chaco survey (almost 70 percent of the total, Table 5.1). Groundstone, hammerstones, minerals, and ornaments are excluded. Only seven local material types are used, as sandstone, shale, and other minerals are types that apply almost exclusively to groundstone, hammerstones, minerals, or ornaments.
Temporal Patterns in the Distribution of Chipped Stone Material
¶ 43 Almost 72 percent of the chipped stone from Anasazi sites could be included in five time groups which range from A.D. 550 to 1230. Within this dated assemblage, local materials comprised slightly over 90 percent of the chipped stone during all time groups. Relative proportions of local materials varied only modestly (5 to 14 percent) through time, with most varying less than 10 percent (see column percentages in Table 5.18). The proportion of nonlocal materials to total chipped stone nearly doubles through time, from 6 percent of the assemblage before A.D. 1030 to more than 11 percent of the assemblage after A.D. 1030. The proportions of the majority of nonlocal materials increase over time (column percents). One of the exceptions, obsidian, accounts for more than 3 percent of the A.D. 550-750 time period assemblage, but in subsequent periods never breaks out of the 1 percent range. No single nonlocal material comprised more than 5 percent of the assemblage during any time period, and most comprised less than 2 percent.
Table 5.18. Distribution of material type by Anasazi time period.
Temporal Patterns in the Distribution of Chipped Stone Material by Survey Area
¶ 44 Within each survey area, relative proportions of local materials (column percents) varied only modestly through time (5 to 15 percent) with only a few exceptions, although there were differences between areas. The nonlocal materials (column percents) tended to increase through time in all areas, although with some exceptions that may be due to small sample sizes (Table 5.19).
Table 5.19. Distribution of material type by Anasazi time periods and survey area.
¶ 45 On Chacra Mesa, chalcedonic silicified wood is the most common local material in all time groups and accounts for over 30 percent of the chipped stone during all time groups. Chalcedonic silicified wood is also the most frequent local material at sites in the South Addition throughout time, except for the earliest time group (A.D. 550 to 750) when high surface chert predominates (29 percent). At Kin Bineola, high surface chert is the most common local material in all time groups, except from A.D. 1030 to 1130 when chalcedonic silicified wood is more common. Kin Klizhin shows less regularity in occurrence of local materials over time than the other survey areas although splintery silicified wood and miscellaneous chert/chalcedony are generally the most common local types. However, from A.D. 700 to 880, cherty wood is most common.
¶ 46 Temporal variability in local materials through time within each survey area appears to be slight, yet it seems that the types of local materials selected for use differed between survey areas. This might suggest the expedient use of readily available material. Although geological studies of lithic sources in each survey area are not available, the archeological patterning of local materials at the four survey areas could be expected to correspond with the natural occurrence of the materials at these areas.
¶ 47 The temporal distribution of nonlocal materials is displayed graphically in Figure 5.3. Kin Bineola has higher relative frequencies of nonlocal material during all time periods, and yellow-brown spotted chert is always the most frequent nonlocal type in this survey area. During the two earliest time periods (A.D. 550 to 880), Chacra Mesa has a comparatively high frequency of nonlocal material, especially obsidian. During the period from A.D. 890 to 1025, frequencies of nonlocal materials are low in all areas, even relatively low at Kin Bineola (even though this appears to be the period that the Kin Bineola Chacoan structure (29SJ 1580) was constructed (see Chapter 2). In the following period (A.D. 1030 to 1130), the frequency of nonlocal materials increases in all areas. Nonlocal materials continue to be high in frequency in all areas during the final time period (A.D. 1130 to 1230), except for the South Addition which had no sites assigned to this time period.
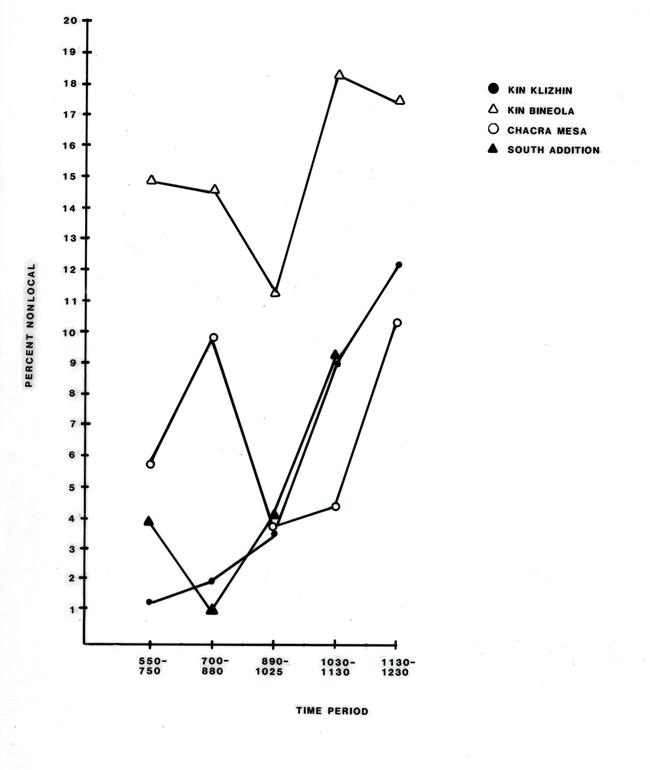 |
Figure 5.3. Percent of nonlocal chipped stone by Anasazi time period and survey area. |
¶ 48 It is interesting to note that no single nonlocal material forms more than 6 percent of the assemblage during any time period in any area except for yellow-brown spotted chert at Kin Bineola (Table 5.19). This contrasts with the occurrence of nonlocal materials at excavated sites in Chaco Canyon, where, after A.D. 1020, Narbona Pass chert was the most common nonlocal material and formed up to 20 percent of the assemblage at some sites. There is a small increase in the frequency of Narbona Pass chert at sites in the survey areas during the period from A.D. 1030 to 1130 (rising from 2 percent to 4 percent of the assemblage), suggesting interaction between populations in Chaco Canyon and those in the survey areas, but this interaction may have been minimal. In contrast to sites in the survey areas, in Chaco Canyon yellow-brown spotted chert was found infrequently (Cameron 1997).
Distribution of Material Type by Site Type Group
¶ 49 The distribution of nonlocal material type by site type group in the four survey areas can be used to examine the degree to which access to nonlocal materials was restricted to certain types of sites (such as Chacoan structures or great kivas) and the degree to which nonlocal material was used at limited activity sites. Chacoan structures in Chaco Canyon have been associated with high frequencies of nonlocal chipped stone material (Cameron 1984), and suggestions have been made that social differences existed between inhabitants of Chacoan structures and small house sites (referred to as habitations or large structures in this chapter) in the canyon (Vivian 1970), which might be evident in differential access to nonlocal materials. While differential access to nonlocal chipped stone material at these sites has not been established (Cameron 1997), the Chacoan structure or great house: small house site comparison remains an interesting one.
¶ 50 Table 5.20 contrasts material frequencies for four site type groups: Chacoan Structures/great kivas, large structures (which include habitation sites of three rooms or more), small structures (which include fieldhouses, ledgerooms, and fieldhouse/habitation sites) and nonstructural sites (which include artifact scatters, hearths, baking pits, storage features, roads/trails, etc.). The relative frequency of nonlocal material (all types combined) at site type groups in the survey areas ranged from 3 percent to 16 percent (Table 5.20). Chacoan Structures and great kivas contained the highest percentages of nonlocal material in each of the three survey areas where this site type was found. In the Kin Klizhin survey area, the Kin Klizhin site itself was the only Chacoan structure present. However, in the Kin Bineola survey area, besides the large Kin Bineola Chacoan structure (29SJ 1580), there was another, smaller Chacoan structure (29Mc 291), a great kiva/habitation site (29Mc 261), and an isolated trash mound near the Kin Bineola site (29SJ 2531) all of which contributed lithics (the trash mound was recorded separately but is presumed to be associated with 29SJ 1580). Each of these structures (except 29SJ 2531 which had a low total frequency) showed very similar relative frequencies of nonlocal materials (15 percent to 17 percent), indicating that the large Kin Bineola Chacoan structure did not have greater access to nonlocal materials than did other Chacoan Structures and great kivas in the community.
Table 5.20. Distribution of nonlocal materials by Anasazi site type groups and area.
¶ 51 The difference in relative frequency of nonlocal material between Chacoan Structures and great kivas and large structures was minimal (<2 percent) at Kin Bineola and Chacra Mesa (Table 5.20). Only in the Kin Klizhin area is there a substantial difference in the percentage of nonlocal materials, and here the sample size at the Kin Klizhin Chacoan structure is low. Again it would seem that the inhabitants of Chacoan Structures and great kivas did not have greater access to nonlocal raw materials than did those of other types of habitation sites. In other words, based on chipped stone data, there is no evidence that residents of Chacoan structures or great kivas controlled or restricted the distribution of nonlocal chipped stone raw material. Based on the predictions of the periodic population aggregation hypothesis described earlier, this may indicate that periodic events held at Chacoan structures and great kivas were attended primarily by local residents, or that these structures were not used for periodic gatherings. Small structures (fieldhouses) and nonstructural sites (limited activity sites) had the lowest relative frequency of nonlocal material in each survey area, which suggests that nonlocal material was not commonly transported to these types of sites or used for the limited sorts of activities which these sites represent.
Occurrence of Nonlocal Materials Based on Distance to Chacoan Structures and Great Kivas
¶ 52 Because the proportional differences between Chacoan structures and habitations are small, one possible explanation is that Chacoan structures and/or great kivas may be origin points for the distribution of goods to nearby sites. Chacoan structures and great kivas in the Kin Klizhin, Kin Bineola, and Chacra Mesa survey areas had higher relative frequencies of nonlocal materials than did other types of sites. The effect of this higher nonlocal frequency on surrounding sites can be evaluated by plotting the relative frequency of nonlocal material at surrounding sites against the distance (meters) to the nearest Chacoan structure or great kiva. Thus, the fall-off in the relative frequency of nonlocal material can be examined as a function of distance to a possible source, in this case a Chacoan structure or great kiva.
¶ 53 The sites used for comparison in this analysis include only habitation sites (those with more than 3 rooms) in the Kin Klizhin and Kin Bineola survey areas. This selection was made to eliminate biases introduced by site function and sample size. Only proveniences at these sites with more than thirty pieces of chipped stone were considered. The proveniences selected for comparison were also restricted to those which dated to two time periods: A.D. 890 to 1025 and A.D. 1030 to 1130. The Chacoan structures and great kivas in the Kin Klizhin and Kin Bineola survey areas, against which distances are plotted, are listed in Table 5.21. It should be noted that the Kin Klizhin Chacoan structure was occupied only during the A.D. 1030-1130 time period, and the 29Mc 261 great kiva was not used during the A.D. 1030 to 1130 time interval. The Padilla Well great kiva is located about 5 km to the northeast of the Kin Klizhin Chacoan structure, outside the area surveyed by this project.
|
Table 5.21. Great kivas and Chacoan structures used in rank ordering of distance by survey areas and time group. |
||
|---|---|---|
| Time Group (A.D.) | ||
| Survey Area/Site Type | 890-1025 | 1030-1130 |
| Kin Klizhin | ||
| Great Kiva | 29SJ 352
(Padilla Wella) |
29SJ 352
(Padilla Well) |
| Chacoan Structure | - | 29SJ 1413
(Kin Klizhin) |
| Kin Bineola | ||
| Great Kiva | 29Mc 261 | 29SJ 352
(Padilla Well) |
| Chacoan Structure | 29SJ 1580
(Kin Bineola) |
29SJ 1580
(Kin Bineola) |
| aPadilla Well lies outside the Kin Klizhin survey area, ca. 5 km to the northeast of the Kin Klizhin Chacoan structure. | ||
¶ 54 Ideally, the relative frequency of each raw material should be compared separately because mechanisms used to procure materials may have differed for each of the different nonlocal types. However, frequencies of each nonlocal material type were so low that the total of all nonlocal material types had to be used in the comparison. Because only a few proveniences met both time and/or sample size (n>30) criteria in each survey area (between 5 and 9 proveniences in each comparison), it was not possible to use a regression analysis to evaluate the effects of distance. Instead, Table 5.22 shows sites ranked by distance to nearest Chacoan structure or great kiva.
Table 5.22. Proportion of nonlocal material at Anasazi sites in the Kin Klizhin and Kin Bineola survey areas ordered by distance to nearest Chacoan structure or great kiva.
¶ 55 No clear pattern of increasing or decreasing frequency of nonlocal material with increasing distance from Chacoan structures or great kivas was apparent at either survey area. As was noted above, nonlocal materials are more frequent during the later time period (A.D. 1030 to 1130) and are more frequent at Kin Bineola than at Kin Klizhin; however, the relative frequency of nonlocal materials, within the time period and survey area groups, does not seem to be affected by proximity to either Chacoan structures or great kivas in this sample. Table 5.22 does show very high frequencies on nonlocal material at some sites, however.
Comparison with Chaco Canyon and with Other Sites in the Region
¶ 56 In this section, frequencies of nonlocal chipped stone materials at the survey sites are compared to those at sites of similar size and time period in Chaco Canyon, and elsewhere in the San Juan Basin. These comparisons address: 1) the degree to which small house sites (large structures) in Chaco Canyon had greater access to nonlocal chipped stone material than did contemporary large structures in the survey areas; 2) access to nonlocal material at Chacoan structures in Chaco Canyon, compared to Chacoan structures and great kivas in the survey areas; and 3) the degree to which other Chacoan sites in the region resemble those in the survey areas in terms of nonlocal chipped stone frequencies.
¶ 57 The relative frequencies of nonlocal materials at large structures (those sites with more than three rooms), in the four survey areas have wider ranges and often higher percentages (1-19%) than the percentages of nonlocal materials at small houses in Chaco, which range from about 3 to 11 percent (Table 5.23). Higher percentages at large structures are predominant during the A.D. 1030-1130 and 1130-1230 time periods, and during all five time periods at Kin Bineola. Relative frequencies of individual nonlocal materials are low in both the additions survey areas and Chaco Canyon (generally less than 5 percent). Interestingly, the few exceptions showing higher individual frequencies of nonlocal materials are outside the Canyon in the Kin Klizhin and Kin Bineola survey areas.
Table 5.23. Distribution of nonlocal material at large structural sites from the survey areas and from small house sites in Chaco Canyon by time period and area.
¶ 58 These exceptions consist primarily of proveniences at Kin Bineola with higher frequencies of yellow-brown spotted chert in all time periods. The source of this material has not been clearly identified, although it is thought to be south of the Chaco Canyon area (about 60 km) in the Zuni Mountain highlands (Kilby 2005; LeTourneau 1997; Whitmore 1979). It is possible that the Kin Bineola area may have had greater social and/or economic ties to the south than did the other survey areas and yellow-brown spotted chert was obtained incidentally during other sorts of economic tasks in this southern region. On Chacra Mesa, obsidian was relatively common during the latest (7 percent) and earliest (4 percent) time periods, although the sample size is small during the latest time period. A recent reexamination of Shabik'eshchee Village (a Basketmaker III site located on Chacra Mesa) indicates that obsidian use at the site may have been even more extensive than previously thought (Thomas C. Windes, personal communication 1999).
¶ 59 There is some evidence that the chipped stone counts from small house (large structures) sites in Chaco Canyon used in Table 5.23 may not represent the full temporal range (Cameron 1997). In particular, the period from A.D. 1050 to 1100 may not be represented. This was the period of greatest construction activity at Chacoan structures in Chaco Canyon (Lekson 1984) and the period when nonlocal chipped stone (especially Narbona Pass chert) was most prevalent. There is some evidence based on unprovenienced chipped stone from Bc 362 and a surface survey of 29SJ 839 that small house sites in the Canyon during the A.D. 1050 to 1100 period may have obtained quantities of Narbona Pass chert far higher than that indicated by the present excavated sample of small house sites (Cameron 1984). However, with the exception of this 50-year period, it would appear that access to nonlocal chipped stone was the same for sites inside the canyon as it was for sites in the survey areas (with the exception of yellow-brown spotted chert at Kin Bineola).
¶ 60 Table 5.24 tabulates nonlocal material frequencies by time period for Chacoan structures and great kivas located in the survey areas, and for Chacoan structures in Chaco Canyon. The sample is small for the earliest and latest periods, with most of the sites falling into the A.D. 1030 to 1130 time group. Two trends are apparent: 1) the frequency of Narbona Pass chert becomes very high at Chacoan structures in Chaco Canyon during the A.D. 1030 to 1130 time group, and this trend is also seen (although not as strongly) at Chacoan structures in the survey areas; 2) like large structural sites, the two Chacoan structures (29SJ1580 and 29Mc 291) in the Kin Bineola survey area have high frequencies of yellow-brown spotted chert during both time periods (A.D. 890-1025 and 1030-1130) they were in use.
Table 5.24. Distribution of nonlocal material at Chacoan structures and great kivas in the survey areas compared to some Chacoan structures in Chaco Canyon.
¶ 61 Whereas an explanation of the high frequencies of yellow-brown spotted chert at Kin Bineola is not yet possible, the relatively high frequency of Narbona Pass chert at Chacoan structures in Chaco Canyon has been interpreted as the result of periodic aggregation of populations from the surrounding region during which chipped stone was imported only incidentally along with other types of goods (Cameron 1984). This interpretation was based on analyses of chipped stone and ceramic data from trash mounds which suggested a population larger than would be indicated by architecture alone. If this is indeed the case, chipped stone evidence from the survey areas suggests that Chacoan structures and great kivas were not experiencing similar events or at least not interacting as frequently with individuals from the Chuska Mountains. As discussed above, Chacoan structures and a great kiva in the Chacra Mesa survey area seem to have nonlocal material frequencies similar to those of large structures (habitation sites), suggesting that access to nonlocal materials was not restricted to Chacoan structures and great kivas. Presuming that periodic aggregations did occur at these sites, the majority of the participants may have been local residents.
¶ 62 An examination of the regional distribution of Narbona Pass chert in the San Juan Basin has shown far higher frequencies at sites in Chaco Canyon than would be expected through a normal fall-off with distance from source. Based on a distance-decay model, only 1 percent Narbona Pass chert would be expected at sites in Chaco Canyon, whereas actual frequencies were much higher (Cameron 1984:144-5). The Chacoan structures in the Kin Bineola and Kin Klizhin survey areas are slightly closer to the Narbona Pass source than sites in Chaco Canyon, and in both of these survey areas, the frequency of Narbona Pass chert also exceeds the expected 1 percent of the total assemblage. The Chacoan structures at Kin Bineola and Kin Klizhin have relative frequencies of Narbona Pass chert that range from 3 to almost 12 percent. Although these frequencies are not nearly as high as those in Chaco Canyon proper, they are higher than would be expected with normal fall-off with distance from the source. The users of the Chacoan structures at Kin Bineola and Kin Klizhin do not seem to have imported as much Narbona Pass chert as residents of Chacoan structures in Chaco Canyon, but there is little evidence that access to this material was restricted. Chacoan structures and large structural sites both inside and outside Chaco Canyon had access to Narbona Pass chert.
¶ 63 Bis sa'ani, a Chacoan outlier located just north of Chaco Canyon has been excavated, along with a number of sites in the surrounding community. The Bis sa'ani site itself dates to the period A.D. 1100 to 1150 (Ford 1982). Simmons (1982) notes that 18 percent of the chipped stone from the site was nonlocal material, a frequency which approximates that at the Chacoan Structures and great kivas in the survey areas, especially those at the two outlier areas (Kin Klizhin and Kin Bineola). While Simmons suggests that this percentage approximates that at Chacoan structures in Chaco Canyon, subsequent analysis has indicated that the frequency of nonlocal material at Chacoan structures in Chaco Canyon may be much higher than this, ranging from 30 percent to 50 percent (Cameron 1984). For example, the late component at Pueblo Alto (A.D. 1130 to 1230) which is partially contemporary with Bis sa'ani has almost 30 percent nonlocal material (Table 5.24). Thus, Bis sa'ani resembles Chacoan Structures and great kivas in the survey areas in frequency of nonlocal material and does not have the extremely high nonlocal material frequencies found at Chacoan structures in Chaco Canyon.
¶ 64 Furthermore, unlike Chaco Canyon where the most common nonlocal material is Narbona Pass chert, almost 10 percent of the nonlocal material at Bis sa'ani is obsidian, a relative frequency higher than that at any of the Chacoan Structures and great kivas in the survey areas (Table 5.24). High frequencies of obsidian are also noted at sites in Chaco Canyon during the period A.D. 1120 to 1220. The single great kiva dating to this period in the Chacra Mesa survey area (29SJ 2557) did not have a high frequency of obsidian (Table 5.24), but, as noted above, large structural sites on Chacra Mesa dating to A.D. 1130 to 1230 (Table 5.23) did have elevated frequencies of obsidian. Sources of obsidian found in Chaco Canyon are currently undergoing re-analysis (Thomas C. Windes, personal communication 1999). Trace element analyses conducted in the early 1980s suggested that most of the obsidian recovered from Chaco-era proveniences had been procured in the Jemez Mountains about 90 km southeast of Chaco Canyon. Based on more recent re-analyses, some of this material may have come from a much closer source to the south near Grants, New Mexico.
¶ 65 “Small pueblos” in the Bis sa'ani community had nonlocal material frequencies that ranged from 0 percent to 5 percent (Simmons 1982:1001). These frequencies approximate those found at large structural sites in three of the four survey areas (except Kin Bineola) where nonlocal material frequencies range from 5 percent to 7 percent (Table 5.20). This indicates the similarity of the distribution of nonlocal material at Bis sa'ani and at sites in the survey areas, although the most common types of nonlocal materials may differ.
Material Selection at Sites of Archaic, Navajo and Other Cultural Affiliation
¶ 66 As discussed above under cultural affiliation in the spatial and temporal framework, more than 90 percent of the lithics associated with sites of Archaic, Navajo, or Other/Unknown cultural affiliation were found on Chacra Mesa, and most of the remaining lithics from these cultural groups were at Kin Klizhin. Only these two areas are discussed here.
¶ 67 Chipped stone material frequencies at Archaic, Navajo, and Other/Unknown components on Chacra Mesa were remarkably similar both to each other and to material frequencies at Anasazi sites (Table 5.25). The similarity at Navajo sites may be partially explained by reuse of chipped stone materials from Anasazi or Archaic sites by Navajo populations. However, the material type differences often noted between Archaic and Anasazi sites (Moore 1983; Simmons 1982:1008) were not apparent at sites on Chacra Mesa. Nonlocal materials were not common for any cultural group, although Navajo sites had a slightly higher proportion of nonlocal material (8 percent) than did Archaic (4 percent) or Other/Unknown sites (3 percent). The nonlocal proportion at these sites was similar to that at Anasazi sites (5 percent).
Table 5.25. Material type by culture for Chacra Mesa and Kin Klizhin.
¶ 68 As discussed previously, Archaic and Other/Unknown sites on Chacra Mesa consist most often of aceramic, astructural lithic scatters. It appears that Chacra Mesa may always have functioned as a special use area at which non-diagnostic materials were used so that the accurate assignment of these sites to a cultural phase is problematic. Two alternatives may account for the similarity in material type among cultural groups: 1) most of these lithic scatters are of the same cultural affiliation and some have been incorrectly identified, or 2) material selection by all cultural groups utilized the same readily available local material types. Technological differences which are apparent between Archaic and Anasazi chipped stone assemblages (Lithic Technology section below) suggest that the second option is the correct one.
¶ 69 At Kin Klizhin, some differences in selection of raw material are apparent (Table 5.25). Archaic sites had a much higher frequency of high surface chert than did Anasazi or Other/Unknown sites. Other/Unknown sites differed from both Archaic and Anasazi sites in a very high relative frequency of miscellaneous chert/chalcedony (36 percent). Very few lithics from Navajo sites were found at Kin Klizhin. While these differences may indicate different preferences in material selection among cultural groups, they are more likely the result of the small total number of lithics associated with non-Anasazi sites in this area.
Discussion
¶ 70 Material selected for chipped stone production at sites in the survey areas, during all cultural phases, was primarily from local sources. Differences in the types of local materials selected in different survey areas suggests that the most readily available local materials were used (although exact sources for local materials in each survey area have not been identified). Nonlocal chipped stone material was not common at sites in the survey areas and the small quantities present clearly do not suggest any sort of large-scale procurement system. Higher relative frequencies of nonlocal materials were evident at Chacoan Structures, great kivas and large structural sites, and lower frequencies were found at small structures and astructural sites, indicating that nonlocal material was most commonly associated with habitation sites and not with limited activity sites, perhaps as a result of the expedient nature of activities carried out at limited activity sites. Unlike Chacoan Structures in Chaco Canyon, Chacoan structures and great kivas did not appear to have significantly greater access to nonlocal material than did other types of habitation sites. This may suggest that if periodic aggregations were held at these sites, they were attended primarily by local residents.
¶ 71 Yellow-brown spotted chert was the most common nonlocal material, although frequencies were low. Much of this material type was found in the Kin Bineola survey area. Other nonlocal material types were less frequent, although an increase in Narbona Pass chert (to 4 percent) occurred in most areas during the period from A.D. 1030 to 1130, the period when the Chacoan regional system was at its peak.
¶ 72 Based on the present data, access to nonlocal materials does not seem to have been restricted either to residents of Chaco Canyon or to residents of Chacoan structures in the survey areas. On the other hand, the extremely high frequencies of nonlocal material (30 to 60 percent) found at Chacoan structures inside Chaco Canyon during the A.D. 1030-1130 and 1130-1230 time groups suggests more contact between Canyon residents and source areas than can be postulated with residents of outlier sites.
¶ 73 In the early 1980s, chipped stone data were used to evaluate the idea that goods were imported into Chaco Canyon and redistributed to outlying Chacoan structures throughout the San Juan Basin (Cameron 1984, 1997). Elevated frequencies of nonlocal material (especially Narbona Pass chert) were found only at those Chacoan structures immediately surrounding Chaco Canyon. Because elevated frequencies of nonlocal materials were not found at more distant outliers, redistribution was rejected as an explanation for the distribution of nonlocal chipped stone material. Data from this study also show that significant quantities of nonlocal material are found at sites (Chacoan structures and large structures) immediately surrounding Chaco Canyon. Rather than rejecting redistribution as an explanation for the Chacoan Regional system, however, we might want to consider that the outlier communities immediately surrounding Chaco Canyon had a special relationship with Canyon residents that resulted in transferal of nonlocal chipped stone from Canyon to outlier. Alternatively, of course, residents of outliers near Chaco Canyon may simply have accessed distant sources themselves.
Lithic Technology
¶ 74 Lithic technology is discussed in three sections: chipped stone, raw material utilization, and other lithic materials such as groundstone, minerals, and ornaments. Technological aspects of the chipped stone assemblage were examined by separating the assemblage into two categories: debitage and tools. The techniques and extent of raw material reduction are addressed in the analysis of debitage, while examination of the tool assemblage discusses functional variability. Changes over time and space in the production and use of chipped stone are addressed by examining grouped site types rather than individual sites. For each section the methodology utilized in the analysis is discussed in detail. This discussion is followed by the results of the analysis and interpretations. Patterns of technological and functional variability found in the analysis of the lithic assemblage from the inventory survey are then compared with the findings of other lithic analyses in the San Juan Basin. Next, technological aspects of raw material utilization for chipped stone production are addressed by contrasting the use of local and nonlocal raw materials. Finally, temporal and spatial variation in the proportions of groundstone, minerals, and ornaments are described.
Debitage
¶ 75 The analysis of the waste flakes or debitage, which are the byproducts of stone tool manufacture, is used to examine various types of raw material reduction. This analysis focuses on the identification of bifacial reduction and more expedient types of reduction such as flake production. The bifacial reduction technique is defined as a reduction technique in which “raw material is reduced principally from parallel but opposing axes to create a tool flaked on both its sides” (Kelly 1985:129). The purpose of this reduction technique is to produce a tool with a formalized shape. Flake production “encompasses an array of techniques in which fairly large flakes are driven off a core. The object in flake technology is to produce easily handled flakes with a usable cutting edge” (Kelly 1985:130-131). Flake production is often used to produce tools without a formalized shape, also called informal tools (i.e., utilized/retouched pieces).
¶ 76 Temporal and spatial variability in chipped stone tool manufacture are discussed in several ways. First, cultural differences (i.e., Archaic, Anasazi, and Navajo) are examined. Next, spatial and functional differences in chipped stone technology are examined through the analysis of Anasazi site and feature types. This analysis focuses on the general differences between structural and nonstructural site types, between Chacoan structures and other site types which contain structures, and more specifically between feature types such as pithouses and roomblocks which are the building blocks of large structures. Finally, temporal differences within the Anasazi period are analyzed.
Method of Debitage Analysis
¶ 77 Raw material reduction is examined through the comparison of debitage categories. The debitage was divided into various flake types and angular debris (Table 5.26). The definition of flake types is based on the proportion of cortex on the outer surface of the flake, platform type, and shape of the flake (Appendix 5.3). These flake attributes change during the reduction process, and hence, certain flake types are more common during a specific stage in the manufacturing sequence. Consequently, the initial series of flakes (primary flakes) which are removed from a core are largely covered with cortex. The next series of flakes (secondary) which are removed have simple platforms and less cortex than primary flakes. If the manufacture of a biface is the end product of this reduction process, then the next series of flakes removed from the core are biface thinning flakes which are described in detail in Appendix 5.3. Angular debris is also a byproduct of the manufacturing process and is therefore a cultural, not a natural, phenomena.
Table 5.26. Total lithic assemblage.
¶ 78 This method of classifying debitage can be used to distinguish two different types of reduction: flake production which contains debitage assemblages with few biface thinning flakes and biface manufacture which contains relatively higher proportions of biface thinning flakes. However, by itself the proportion of various flake types does not make a convincing argument for differences in reduction techniques. The formal to informal tool ratio (see definition below), and the percentage of tools which are manufactured using bifacial reduction techniques (such as bifaces and projectile points) are also used to support interpretation about reduction techniques. The distinction between biface reduction and flake production techniques has been recognized as important in the Southwest because early sites (PaleoIndian and Archaic) have been shown to rely heavily on bifacial reduction, while Anasazi sites utilize a more expedient technology which often stresses flake production (Chapman 1977; Parry and Kelly 1987; Simmons 1982; Sullivan and Rozen 1985).
¶ 79 Two ratios (debitage to tool and formal to informal tools) were calculated using various combinations of artifact types. Debitage is defined as all the flake types and angular debris. Tools are divided into formal and informal categories. Informal tools are pieces of chipped stone which show some type of use or retouch but were not formally shaped (i.e., utilized/retouched pieces), while formal tools are chipped stone artifacts which have a formalized shape such as projectile points, scrapers, bifaces, and drills. Cores, hammerstones, and the other tools are not considered in either the debitage to tool ratio or the formal to informal tool ratio. The debitage to tool ratio is used to identify locations where raw materials were reduced. A high proportion of debitage relative to the number of tools is expected at sites where lithic reduction was undertaken. A high formal to informal tool ratio is expected at sites where biface reduction was emphasized. Specifically, rejected bifaces are expected to be more common at sites where biface manufacture occurred.
Total Assemblage
¶ 80 The total chipped stone assemblage (excluding lithic items such as groundstone, minerals, and ornaments) consists of 24,365 artifacts, of which 1,779 (7.3 percent) are tools as shown in Table 5.26. Table 5.27 gives the percentages of debitage which were recorded for the entire assemblage, and Table 5.28 provides ratios of debitage to tools and of formal to informal tools. On average, 12 pieces of debitage were found for each tool (excluding cores, hammerstones, and other tools). Variation in the chipped stone assemblage at the survey areas is minimal with one exception (Tables 5.29 and 5.30). The Kin Klizhin survey area contains a high proportion of angular debris and more formal tools, but these differences were probably created by the methodological problems brought about by the use of different recording forms in this area during the initial weeks of the survey (see Appendix 5.3 for further details).
|
Table 5.27. Total debitage by flake type. |
||
|---|---|---|
| Flake Type | No. | % |
| Primary | 867 | 4.0 |
| Secondary | 6,496 | 30.0 |
| Angular debris | 14,031 | 64.7 |
| Biface thinning | 288 | 1.3 |
| TOTAL | 21,682 | |
|
Table 5.28. Total debitage to tool and formal to informal tool ratios. |
||
|---|---|---|
| Artifact Type | No. | Ratio |
| Debitage | 21,682 | 12.2 |
| Tool | 1,779 | |
| Formal | 468 | 0.36 |
| Informal | 1,311 | |
|
Table 5.29. Flake type percentages by survey area. |
||||||||
|---|---|---|---|---|---|---|---|---|
| Survey Area | ||||||||
| Kin Klizhin | Kin Bineola | Chacra Mesa | South Addition | |||||
| Flake Type | No. | % | No. | % | No. | % | No. | % |
| Primary | 122 | 2.7 | 240 | 5.5 | 343 | 2.9 | 162 | 14.6 |
| Secondary | 239 | 5.2 | 1,043 | 24.1 | 4,708 | 40.4 | 506 | 45.5 |
| Angular debris | 4,143 | 90.5 | 3,040 | 70.2 | 6,417 | 55.0 | 431 | 38.8 |
| Bifacial thinning flake | 74 | 1.6 | 5 | 0.1 | 196 | 1.7 | 13 | 1.2 |
| TOTAL | 4,578 | 4,328 | 11,664 | 1,112 | ||||
|
Table 5.30. Ratios of all debitage and tools, and formal and informal tools by survey area. |
||||||||
|---|---|---|---|---|---|---|---|---|
| Survey Area | ||||||||
| Kin Klizhin | Kin Bineola | Chacra Mesa | South Addition | |||||
| Artifact Type | No. | Ratio | No. | Ratio | No. | Ratio | No. | Ratio |
| Debitage | 4,578 | 32.7 | 4,328 | 10.0 | 11,664 | 10.4 | 1,112 | 12.8 |
| Tool | 140 | 432 | 1,120 | 87 | ||||
| Formala | 73 | 1.1 | 105 | 0.32 | 270 | 0.32 | 20 | 0.30 |
| Informalb | 67 | 327 | 850 | 67 | ||||
| aProjectile points, scrapers, bifaces, and drills.
bUtilized and retouched flakes. |
||||||||
Variation by Cultural Groups
¶ 81 By comparing the proportions of flake types across cultural groupings (Archaic, Anasazi, and Navajo), one can see general differences in the reduction strategies used by each cultural group. Archaic sites (all survey areas combined) contain a higher percentage of biface thinning flakes (3.3 percent) when compared to Anasazi (1.0 percent) and Navajo (1.2 percent) sites (Table 5.31). This pattern was also found within specific survey areas; for example, at the Kin Klizhin (Table 5.32) and Chacra Mesa areas (Table 5.33). The Kin Bineola and the South Addition survey areas did not contain sites which were classified as Archaic, and hence, these two survey areas are not addressed. Because the sample sizes and percentage of biface thinning flakes are low, a discussion of possible differences in Archaic reduction strategies cannot rely on this evidence alone. The formal to informal tool ratio and the proportion of bifacially worked tools, such as bifaces and projectile points, are used to further examine these differences. A relatively high proportion of formal tools were recorded from Archaic sites (0.71) as compared to the later Anasazi and Navajo sites (Table 5.34). In addition, at Archaic sites, bifaces and projectile points comprise over 23 percent of the assemblage, which is substantially higher than in Anasazi sites (8.3 percent) (Table 5.35). These findings suggest that bifacial reduction was utilized more frequently at Archaic sites. The substantially higher proportion of projectile points at Archaic sites suggests that biface reduction was undertaken particularly for the purpose of producing this tool type. This pattern is similar to data recorded for Archaic sites in other parts of the Southwest (Parry and Kelly 1987; Simmons 1982; Sullivan and Rozen 1985).
|
Table 5.31. Flake type percentages for Anaszai, Navajo, Archaic, Archaic/Anasazi, and Other/Unknown sites. |
||||||||||
|---|---|---|---|---|---|---|---|---|---|---|
| Culture | ||||||||||
| Anasazi | Navajo | Archaic | Archaic/ Anasazi | Other/ Unknown | ||||||
| Flake Type | No. | % | No. | % | No. | % | No. | % | No. | % |
| Primary | 699 | 4.3 | 31 | 4.2 | 30 | 6.6 | 88 | 2.4 | 19 | 2.7 |
| Secondary | 4,317 | 26.8 | 296 | 39.9 | 108 | 23.7 | 1,530 | 41.4 | 245 | 34.8 |
| Angular debris | 10,905 | 67.8 | 406 | 54.7 | 303 | 66.4 | 2,006 | 54.3 | 411 | 58.4 |
| Bifacial thinning flake | 166 | 1.0 | 9 | 1.2 | 15 | 3.3 | 69 | 1.9 | 29 | 4.1 |
| TOTAL | 16,087 | 742 | 456 | 3,693 | 704 | |||||
|
Table 5.32. Flake type percentages at sites in the Kin Klizhin survey area from the Anasazi, Navajo, Archaic, and Other/Unknown cultures. |
||||||||||
|---|---|---|---|---|---|---|---|---|---|---|
| Culture | ||||||||||
| Anasazi | Navajo | Archaic | Other/ Unknown | |||||||
| Flake Type | No. | % | No. | % | No. | % | No. | % | ||
| Primary | 96 | 2.3 | - | - | 25 | 12.0 | 1 | 0.5 | ||
| Secondary | 194 | 4.7 | - | - | 34 | 16.3 | 11 | 5.3 | ||
| Angular debris | 3,791 | 91.3 | 14 | 100 | 144 | 69.2 | 194 | 94.2 | ||
| Bifacial thinning flake | 69 | 1.7 | - | - | 5 | 2.4 | - | - | ||
| TOTAL | 4,150 | 14 | 208 | 206 | ||||||
|
Table 5.33. Flake type percentages at sites in the Chacra Mesa survey area from the Anasazi, Navajo, Archaic, and Other/Unknown cultures. |
||||||||
|---|---|---|---|---|---|---|---|---|
| Culture | ||||||||
| Anasazi | Navajo | Archaic | Other/Unknown | |||||
| Flake Type | No. | % | No. | % | No. | % | No. | % |
| Primary | 208 | 3.2 | 27 | 3.8 | 5 | 2.0 | 103 | 2.5 |
| Secondary | 2,588 | 39.5 | 292 | 41.4 | 74 | 29.8 | 1,754 | 42.2 |
| Angular debris | 3,681 | 56.1 | 378 | 53.5 | 159 | 64.1 | 2,199 | 53.0 |
| Bifacial thinning flake | 81 | 1.2 | 9 | 1.3 | 10 | 4.0 | 96 | 2.3 |
| TOTAL | 6,558 | 706 | 248 | 4,152 | ||||
|
Table 5.34. Ratios of debitage and tools, and formal and informal tools at Anasazi, Navajo, Archaic, Archaic/Anasazi, and Other/Unknown sites. |
||||||||||
|---|---|---|---|---|---|---|---|---|---|---|
| Culture | ||||||||||
| Anasazi | Navajo | Archaic | Archaic/ Anasazi | Other/ Unknown | ||||||
| Artifact Type | No. | Ratio | No. | Ratio | No. | Ratio | No. | Ratio | No. | Ratio |
| Debitage | 16,087 | 12.8 | 742 | 5.9 | 456 | 12.7 | 3,693 | 14.4 | 704 | 6.9 |
| Tool | 1,260 | 125 | 36 | 256 | 102 | |||||
| Formala | 326 | 0.35 | 33 | 0.36 | 15 | 0.71 | 71 | 0.38 | 23 | 0.29 |
| Informalb | 934 | 92 | 21 | 185 | 79 | |||||
| aIncludes projectile points, scrapers, bifaces, and
drills. bIncludes utilized and retouched flakes. |
||||||||||
|
Table 5.35. Tool type percentages at Anasazi, Navajo, Archaic, Archaic/Anasazi, and Other/Unknown sites. |
||||||||||
|---|---|---|---|---|---|---|---|---|---|---|
| Culture | ||||||||||
| Anasazi | Navajo | Archaic | Archaic/Anasazi | Other/ Unknown | ||||||
| Tool Type | No. | % | No. | % | No. | % | No. | % | No. | % |
| Core | 290 | 14.7 | 26 | 13.6 | 9 | 17.3 | 42 | 12.7 | 21 | 14.7 |
| Utilized flake | 934 | 47.4 | 92 | 48.7 | 21 | 40.4 | 185 | 55.7 | 79 | 55.2 |
| Point | 130 | 6.6 | 29 | 15.3 | 11 | 21.2 | 41 | 12.3 | 19 | 13.3 |
| Scraper | 66 | 3.4 | 0 | 0 | 1 | 2.0 | 2 | 0.6 | 1 | 0.7 |
| Biface | 34 | 1.7 | 3 | 1.6 | 1 | 2.0 | 19 | 5.7 | 1 | 0.7 |
| Drill | 96 | 4.9 | 1 | 0.5 | 2 | 3.8 | 9 | 2.7 | 2 | 1.4 |
| Hammerstone | 309 | 15.7 | 22 | 11.6 | 6 | 11.5 | 22 | 6.6 | 13 | 9.1 |
| Other | 110 | 5.6 | 16 | 8.5 | 1 | 2.0 | 12 | 3.6 | 7 | 4.9 |
| TOTAL | 1,969 | 189 | 52 | 332 | 143 | |||||
¶ 82 The Navajo sites contain a low debitage to tool ratio (5.9) compared to Anasazi and Archaic sites (12.8 and 12.7 respectively) (Table 5.34). Although the sample size is small from some survey areas, this pattern is consistent across the four areas (Tables 5.36 to 5.39). By contrast, the formal to informal tool ratio at Navajo sites from all survey areas (0.36) is very similar to that at Anasazi sites (0.35). However, the proportion of projectile points in the tool assemblage (Table 5.35) is higher at Navajo sites (15.3 percent) than at Anasazi sites (6.6 percent). A possible interpretation of these results is that the Navajo were not manufacturing tools at the majority of sites which were examined during the course of the survey and that tools, in particular points, may have been made elsewhere, were brought to the Navajo sites in the survey areas, and then discarded. However, this scenario is unlikely. Given the large area examined during the course of the survey, one would expect to find more evidence of lithic manufacture by Navajos if it were widely practiced. Another possible and more likely interpretation is that the Navajo utilized Anasazi sites as a source of raw material and tools, in particular, projectile points. Vivian (1960:145) suggests that projectile points found at Navajo sites recorded on Chacra Mesa may have been collected from prehistoric sites. A comparison of point styles from Navajo and Anasazi sites is needed to evaluate this interpretation. Specifically, if Navajos scavenged projectile points and other chipped stone artifacts from Anasazi sites, then projectile points found at Navajo sites should be similar to those from Anasazi sites.
|
Table 5.36. Ratios of debitage and tools, and formal and informal tools at sites in the Kin Klizhin survey area from the Anasazi, Navajo, Archaic, and Other/Unknown sites. |
||||||||
|---|---|---|---|---|---|---|---|---|
| Culture | ||||||||
| Anasazi | Navajo | Archaic | Other/ Unknown | |||||
| Artifact Type | No. | Ratio | No. | Ratio | No. | Ratio | No. | Ratio |
| Debitage | 4,150 | 34.0 | 14 | 7.0 | 208 | 17.3 | 206 | 51.5 |
| Tool | 122 | 2 | 12 | 4 | ||||
| Formala | 67 | 1.2 | 0 | 0 | 2 | 0.2 | 4 | 0 |
| Informalb | 55 | 2 | 10 | 0 | ||||
| aIncludes projectile points, scrapers, bifaces, and
drills. bIncludes utilized and retouched flakes. |
||||||||
|
Table 5.37. Ratios of debitage and tools, and formal and informal tools at sites in the Chacra Mesa survey area from the Anasazi, Navajo, Archaic, and Other/Unknown sites. |
||||||||
|---|---|---|---|---|---|---|---|---|
| Culture | ||||||||
| Anasazi | Navajo | Archaic | Other/Unknown | |||||
| Artifact Type | No. | Ratio | No. | Ratio | No. | Ratio | No. | Ratio |
| Debitage | 6,558 | 10.5 | 706 | 5.9 | 248 | 10.3 | 4,152 | 11.8 |
| Tool | 623 | 120 | 24 | 352 | ||||
| Formala | 134 | 0.27 | 33 | 0.38 | 13 | 1.18 | 90 | 0.34 |
| Informalb | 489 | 87 | 11 | 262 | ||||
| aIncludes projectile points, scrapers, bifaces, and
drills. bIncludes utilized and retouched flakes. |
||||||||
|
Table 5.38. Ratios of debitage and tools, and formal and informal tools at sites in the Kin Bineola survey area from the Anasazi, Navajo, and Other/Unknown sites. |
||||||
|---|---|---|---|---|---|---|
| Culture | ||||||
| Anasazi | Navajo | Other/Unknown | ||||
| Artifact Type | No. | Ratio | No. | Ratio | No. | Ratio |
| Debitage | 4,289 | 10.0 | 6 | 6.0 | 33 | 33.0 |
| Tool | 430 | 1 | 1 | |||
| Formala | 105 | 0.32 | 0 | 0 | 0 | 0 |
| Informalb | 325 | 1 | 1 | |||
| aIncludes projectile points, scrapers, bifaces, and
drills. bIncludes utilized and retouched flakes. |
||||||
|
Table 5.39. Ratios of debitage and tools, and formal and informal tools at sites in the South Addition survey area from the Anasazi, Navajo, and Other/Unknown sites. |
||||||
|---|---|---|---|---|---|---|
| Culture | ||||||
| Anasazi | Navajo | Other/Unknown | ||||
| Artifact Type | No. | Ratio | No. | Ratio | No. | Ratio |
| Debitage | 1,090 | 12.8 | 16 | 8.0 | 0 | 0 |
| Tool | 85 | 2 | 0 | |||
| Formala | 20 | 0 | 0.31 | 0 | ||
| Informalb | 65 | 2 | 0 | |||
| aIncludes projectile points, scrapers, bifaces, and
drills. bIncludes utilized and retouched flakes. |
||||||
¶ 83 The Other/Unknown sites are lithic scatters which could not be clearly placed into a cultural or temporal grouping. This category is a combination of cultural sub-categories such as Archaic/Anasazi, Navajo/Anasazi, Historic and Unknown. In this section, the lithic assemblages which were classified as Archaic/Anasazi are analyzed separately from other assemblages which were placed in the Other/Unknown cultural grouping. In further analyses, the Archaic/Anasazi category is not examined separately, but the Other/Unknown cultural grouping is viewed as representative of the Archaic/Anasazi category because the Archaic/Anasazi grouping comprises 82 percent of all the Other/Unknown lithics. The formal to informal tool ratio of the Archaic/Anasazi assemblage is similar to the Anasazi, while the proportion of points and bifaces (18.0 percent) is substantially higher than at Anasazi sites (Table 5.35). The question of whether these sites more closely resemble the Archaic or Anasazi pattern is addressed more specifically in the section which deals with tool assemblages.
Spatial Patterning in Site and Feature Type Groups
¶ 84 Spatial and functional variability are examined by analyzing the debitage assemblages from Anasazi site type groups and feature type groups (see Tables 5.6 and 5.7 for site and feature type groups). Nonstructural site type groups such as camps, baking pits, and scatters are combined into a single group for the purposes of this analysis. In general, the nonstructural sites contain a higher proportion of biface thinning flakes (Table 5.40). The formal to informal tool ratio at nonstructural sites (Tables 5.41 to 5.42) is also slightly higher (0.40), as is the proportion of bifaces and projectile points (12.5 percent). These differences suggest that bifacial reduction and formal tools were emphasized to a slightly greater degree at nonstructural sites. This pattern is expected if the function of the majority of these nonstructural sites is geared toward more specialized and more mobile activities such as hunting and gathering.
|
Table 5.40. Flake type percentages at the Anasazi site types. |
||||||||||
|---|---|---|---|---|---|---|---|---|---|---|
| Anasazi Site Type | ||||||||||
| Large Structure | Great Kiva | Chacoan Structure | Small Structure | Nonstructural | ||||||
| Flake Type | No. | % | No. | % | No. | % | No. | % | No. | % |
| Primary | 488 | 5.0 | 33 | 6.7 | 28 | 3.1 | 53 | 3.8 | 97 | 2.8 |
| Secondary | 2,565 | 25.8 | 136 | 27.8 | 190 | 20.7 | 253 | 17.9 | 1,201 | 35.2 |
| Angular debris | 6,869 | 69.0 | 320 | 65.4 | 698 | 76.2 | 1,098 | 77.8 | 1,977 | 58.0 |
| Biface thinning flake | 27 | 0.3 | 0 | 0 | 0 | 0 | 7 | 0.5 | 133 | 3.9 |
| TOTAL | 9,949 | 489 | 916 | 1,411 | 3,408 | |||||
|
Table 5.41. Ratios of debitage and tools, and formal and informal tools at the Anasazi site types. |
||||||||||
|---|---|---|---|---|---|---|---|---|---|---|
| Anasazi Site Type | ||||||||||
| Large Structure | Great Kiva | Chacoan Structure | Small Structure | Nonstructural | ||||||
| Artifact Type | No. | Ratio | No. | Ratio | No. | Ratio | No. | Ratio | No. | Ratio |
| Debitage | 9,945 | 13.1 | 489 | 12.2 | 916 | 10.2 | 1,411 | 10.5 | 3,408 | 13.3 |
| Tool | 756 | 40 | 90 | 134 | 256 | |||||
| Formala | 200 | 0.36 | 11 | 0.38 | 14 | 0.18 | 33 | 0.33 | 73 | 0.40 |
| Informalb | 556 | 29 | 76 | 101 | 183 | |||||
| aIncludes projectile points, scrapers, bifaces, and
drills. bIncludes utilized and retouched flakes. |
||||||||||
|
Table 5.42. Tool type percentages at the Anasazi site types. |
||||||||||
|---|---|---|---|---|---|---|---|---|---|---|
| Anasazi Site Type | ||||||||||
| Large Structure | Great Kiva | Chacoan Structure | Small Structure | Nonstructural | ||||||
| Tool Type | No. | % | No. | % | No. | % | No. | % | No. | % |
| Core | 175 | 14.8 | 9 | 15.0 | 22 | 17.9 | 33 | 13.2 | 53 | 14.1 |
| Utilized/retouched flake | 556 | 47.0 | 29 | 48.3 | 76 | 61.8 | 101 | 40.4 | 183 | 48.8 |
| Point | 81 | 6.8 | 2 | 3.3 | 3 | 2.4 | 13 | 5.2 | 35 | 9.3 |
| Scraper | 35 | 3.0 | 2 | 3.3 | 6 | 4.9 | 12 | 4.8 | 12 | 3.2 |
| Biface | 21 | 1.8 | - | - | - | - | 1 | 0.4 | 12 | 3.2 |
| Drill | 63 | 5.3 | 7 | 11.7 | 5 | 4.1 | 7 | 2.8 | 14 | 3.7 |
| Hammerstone | 190 | 16.1 | 11 | 18.3 | 8 | 6.5 | 60 | 24.0 | 43 | 11.5 |
| Other | 62 | 5.2 | - | - | 3 | 2.4 | 23 | 9.2 | 23 | 6.1 |
| TOTAL | 1,183 | 60 | 123 | 250 | 375 | |||||
¶ 85 The debitage to tool ratio is fairly consistent at all site types (Table 5.41). The grouped site type large structure was further examined in terms of grouped feature types such as pithouses and large structures. Pithouses contain relatively fewer pieces of debitage per tool than large structures (Table 5.43). Fewer hammerstones are also found at pithouses (see the tool analysis section). These two pieces of evidence suggest that raw material reduction may not have been as frequently performed at pithouse features. The formal to informal tool ratio is also very consistent at the structural sites (excluding Chacoan structures), averaging 0.36 formal tools per informal tool (Table 5.41). Chacoan structures, which have been separated from great kivas for the purpose of this analysis, contained fewer formal tools than other sites with structures. This difference is examined in further detail below.
|
Table 5.43. Ratios of debitage and tools, and formal and informal tools at grouped Anasazi feature types. |
||||||||
|---|---|---|---|---|---|---|---|---|
| Grouped Anasazi Feature Type | ||||||||
| Large Structure | Small Structure | Pithouse | Nonstructural | |||||
| Artifact Type | No. | Ratio | No. | Ratio | No. | Ratio | No. | Ratio |
| Debitage | 7,740 | 14.4 | 1,623 | 16.6 | 2,218 | 9.2 | 4,506 | 11.8 |
| Tool | 539 | 98 | 242 | 381 | ||||
| Formala | 147 | 0.38 | 30 | 0.44 | 47 | 0.24 | 102 | 0.37 |
| Informalb | 392 | 68 | 195 | 279 | ||||
| aIncludes projectile points, scrapers, bifaces, and
drills. bIncludes utilized and retouched flakes. |
||||||||
Temporal Patterning within the Anasazi Period
¶ 86 Several general temporal trends in the proportion of debitage categories can be seen during the Anasazi period (Table 5.44). The proportion of angular debris increases over time. Most striking is the more than 15 percent increase in the percentage of angular debris which occurred between A.D. 550 to 750 and A.D. 700 to 880. In addition, the percentage of secondary flakes decreases between these two time periods. The debitage to tool ratio (Table 5.45) generally also increases over time. Therefore, more debitage was produced at later sites and more of this debitage was without clearly discernable flake characteristics (i.e., bulb and platform). However, an examination of temporal trends in the debitage assemblages (Tables 5.46 to 5.49) within individual survey areas shows that the increase in the proportion of angular debris occurred most clearly at Kin Bineola (Table 5.48). In the South Addition (Table 5.49), the percentage of angular debris increases and then declines over time.
|
Table 5.44. Flake type percentages at Anasazi sites by time period. |
||||||||||
|---|---|---|---|---|---|---|---|---|---|---|
| Time Period | ||||||||||
| A.D. 550-750 |
A.D. 700-880 |
A.D. 890-1025 |
A.D. 1030-1130 |
A.D. 1130-1230 |
||||||
| Flake Type | No. | % | No. | % | No. | % | No. | % | No. | % |
| Primary | 102 | 3.5 | 63 | 5.9 | 79 | 3.2 | 168 | 4.0 | 27 | 3.1 |
| Secondary | 1,133 | 39.0 | 220 | 20.8 | 442 | 17.9 | 986 | 23.5 | 149 | 17.0 |
| Angular debris | 1,651 | 56.8 | 776 | 73.3 | 1,938 | 78.3 | 3,022 | 72.1 | 701 | 79.9 |
| Biface thinning flake | 20 | 0.7 | - | - | 16 | 0.6 | 15 | 0.4 | - | - |
| TOTAL | 2,906 | 1,059 | 2,475 | 4,191 | 877 | |||||
|
Table 5.45. Ratios of debitage and tools, and formal and informal tools at Anasazi sites from the time periods. |
||||||||||
|---|---|---|---|---|---|---|---|---|---|---|
| Time Period | ||||||||||
| A.D. 550-750 |
A.D. 700-880 |
A.D. 890-1025 |
A.D. 1030-1130 |
A.D. 1130-1230 |
||||||
| Artifact Type | No. | Ratio | No. | Ratio | No. | Ratio | No. | Ratio | No. | Ratio |
| Debitage | 2,906 | 9.6 | 1,059 | 10.2 | 2,475 | 13.8 | 4,191 | 16.4 | 877 | 14.9 |
| Tool | 302 | 104 | 179 | 255 | 59 | |||||
| Formala | 72 | 0.31 | 29 | 0.39 | 51 | 0.38 | 70 | 0.38 | 19 | 0.48 |
| Informalb | 230 | 75 | 128 | 185 | 40 | |||||
| aIncludes projectile points, scrapers, bifaces, and
drills. bIncludes utilized and retouched flakes. |
||||||||||
|
Table 5.46. Flake type percentages at Anasazi sites in the Kin Klizhin survey area from the time periods. |
||||||||||
|---|---|---|---|---|---|---|---|---|---|---|
| Time Period | ||||||||||
| A.D. 550-750 |
A.D. 700-880 |
A.D. 890-1025 |
A.D. 1030-1130 |
A.D. 1130-1230 |
||||||
| Flake Type | No. | % | No. | % | No. | % | No. | % | No. | % |
| Primary | - | - | 16 | 4.4 | 4 | 0.3 | 26 | 2.3 | 15 | 3.0 |
| Secondary | - | - | 29 | 8.0 | 4 | 0.3 | 50 | 4.4 | 18 | 3.6 |
| Angular debris | 82 | 100 | 317 | 87.6 | 1,129 | 98.8 | 1,062 | 93.2 | 458 | 92.7 |
| Biface thinning flake | - | - | - | - | 6 | 0.5 | 1 | 0.1 | 3 | 0.6 |
| TOTAL | 82 | 362 | 1,143 | 1,139 | 494 | |||||
|
Table 5.47. Flake type percentages at Anasazi sites in the Chacra Mesa survey area from the time periods. |
||||||||||
|---|---|---|---|---|---|---|---|---|---|---|
| Time Period | ||||||||||
| A.D. 550-750 |
A.D. 700-880 |
A.D. 890-1025 |
A.D. 1030-1130 |
A.D. 1130-1230 |
||||||
| Flake Type | No. | % | No. | % | No. | % | No. | % | No. | % |
| Primary | 64 | 2.5 | 3 | 5.9 | 12 | 4.4 | 36 | 3.1 | 8 | 2.4 |
| Secondary | 1,011 | 40.3 | 25 | 49.0 | 129 | 47.4 | 366 | 31.8 | 125 | 37.8 |
| Angular debris | 1,417 | 56.4 | 23 | 45.1 | 128 | 47.1 | 742 | 64.4 | 198 | 59.8 |
| Biface thinning flake | 19 | 0.8 | - | - | 3 | 1.1 | 8 | 0.7 | - | - |
| TOTAL | 2,511 | 51 | 272 | 1,152 | 331 | |||||
|
Table 5.48. Flake type percentages at Anasazi sites in the Kin Bineola survey area from the time periods. |
||||||||||
|---|---|---|---|---|---|---|---|---|---|---|
| Time Period | ||||||||||
| A.D. 550-750 |
A.D. 700-880 |
A.D. 890-1025 |
A.D. 1030-1130 |
A.D. 1130-1230 |
||||||
| Flake Type | No. | % | No. | % | No. | % | No. | % | No. | % |
| Primary | 14 | 10.8 | 38 | 6.8 | 26 | 3.3 | 60 | 3.9 | 4 | 7.3 |
| Secondary | 36 | 27.7 | 133 | 23.8 | 208 | 26.2 | 359 | 23.1 | 6 | 10.9 |
| Angular debris | 80 | 61.5 | 387 | 69.4 | 559 | 70.4 | 1,127 | 72.9 | 45 | 81.8 |
| Biface thinning flake | - | - | - | - | 1 | 0.1 | 1 | 0.1 | - | - |
| TOTAL | 130 | 558 | 794 | 1,547 | 55 | |||||
|
Table 5.49. Flake type percentages at Anasazi sites in the South Addition survey area from the time periods. |
||||||||
|---|---|---|---|---|---|---|---|---|
| Time Period | ||||||||
| A.D. 550-750 |
A.D. 700-880 |
A.D. 890-1025 |
A.D. 1030-1130 |
|||||
| Flake Type | No. | % | No. | % | No. | % | No. | % |
| Primary | 24 | 13.1 | 6 | 6.8 | 37 | 13.9 | 46 | 13.0 |
| Secondary | 86 | 47.0 | 33 | 37.5 | 101 | 38.0 | 211 | 59.8 |
| Angular debris | 72 | 39.3 | 49 | 55.7 | 122 | 45.9 | 91 | 25.8 |
| Biface thinning flake | 1 | 0.5 | - | - | 6 | 2.3 | 5 | 1.4 |
| TOTAL | 183 | 88 | 266 | 353 | ||||
¶ 87 The debitage to tool ratio shows considerable variability between the time groups of each survey area (Tables 5.50 to 5.52). Because of methodological problems, Kin Klizhin is excluded from this comparison. Only the A.D. 890 to 1025 and the A.D. 1030 to 1130 time groups contain adequate sample sizes from the three survey areas to permit this type of comparison. During the A.D. 890 to 1025 time group, sites within the Chacra Mesa and South Addition survey areas contain approximately 12 pieces of debitage per tool, while sites in the Kin Bineola area contain only 6.7 pieces of debitage per tool (Tables 5.50 to 5.52). The formal to informal tool ratio is fairly consistent across all areas for this time period. During the A.D. 1030 to 1130 time group, the debitage to tool ratio is fairly consistent between the survey areas, as is the formal to informal tool ratio. At Kin Bineola the low ratio of debitage to tools between A.D. 890 and 1025 suggests that its residents may have acquired some raw materials that had already been reduced outside the survey area.
|
Table 5.50. Ratios of debitage and tools, and formal and informal tools at Anasazi sites in the Chacra Mesa survey area from the time periods. |
||||||||||
|---|---|---|---|---|---|---|---|---|---|---|
| Time Period | ||||||||||
| A.D. 550-750 |
A.D. 700-880 |
A.D. 890-1025 |
A.D. 1030-1130 |
A.D. 1130-1230 |
||||||
| Artifact Type | No. | Ratio | No. | Ratio | No. | Ratio | No. | Ratio | No. | Ratio |
| Debitage | 2,511 | 9.7 | 51 | 2.6 | 272 | 11.8 | 1,152 | 12.9 | 331 | 10.7 |
| Tool | 259 | 20 | 23 | 89 | 31 | |||||
| Formala | 55 | 0.27 | 2 | 0.11 | 5 | 0.28 | 21 | 0.31 | 5 | 0.19 |
| Informalb | 204 | 18 | 18 | 68 | 26 | |||||
| aIncludes projectile points, scrapers, bifaces, and
drills. bIncludes utilized and retouched flakes. |
||||||||||
|
Table 5.51. Ratios of debitage and tools, and formal and informal tools at Anasazi sites in the Kin Bineola survey area from the time periods. |
||||||||||
|---|---|---|---|---|---|---|---|---|---|---|
| Time Period | ||||||||||
| A.D. 550-750 |
A.D. 700-880 |
A.D. 890-1025 |
A.D. 1030-1130 |
A.D. 1130-1230 |
||||||
| Artifact Type | No. | Ratio | No. | Ratio | No. | Ratio | No. | Ratio | No. | Ratio |
| Debitage | 130 | 4.8 | 558 | 9.2 | 794 | 6.7 | 1,547 | 15.5 | 55 | 9.2 |
| Tool | 27 | 64 | 118 | 100 | 6 | |||||
| Formala | 7 | 0.35 | 18 | 0.39 | 28 | 0.31 | 26 | 0.35 | 1 | 0.20 |
| Informalb | 20 | 46 | 90 | 74 | 5 | |||||
| aIncludes projectile points, scrapers, bifaces, and
drills. bIncludes utilized and retouched flakes. |
||||||||||
|
Table 5.52. Ratios of debitage and tools, and formal and informal tools at Anasazi sites in the South Addition survey area from the time periods. |
||||||||
|---|---|---|---|---|---|---|---|---|
| Time Period | ||||||||
| A.D. 550-750 |
A.D. 700-880 |
A.D. 890-1025 |
A.D. 1030-1130 |
|||||
| Artifact Type | No. | Ratio | No. | Ratio | No. | Ratio | No. | Ratio |
| Debitage | 183 | 14.1 | 88 | 9.7 | 266 | 12.7 | 353 | 14.1 |
| Tool | 13 | 9 | 21 | 25 | ||||
| Formala | 8 | 1.6 | 2 | 0.29 | 4 | 0.24 | 3 | 0.14 |
| Informalb | 5 | 7 | 17 | 22 | ||||
| aIncludes projectile points, scrapers, bifaces, and
drills. bIncludes utilized and retouched flakes. |
||||||||
Summary of Debitage Analysis
¶ 88 Analysis of the debitage from the inventory survey has shown several general patterns. First, the proportion of biface thinning flakes, the formal to informal tool ratio, and the percentage of bifaces and projectile points recorded at Archaic sites indicated that during the Archaic bifacial reduction was utilized more frequently than during the Anasazi periods. This difference in reduction technique is addressed in further detail in the next section. Second, Navajo sites contained fewer pieces of debitage per tool than Anasazi sites. Scavenging of chipped stone materials from Anasazi sites was suggested as a possible explanation for this pattern. Third, temporal changes in the Anasazi assemblages were discussed. When all survey areas were considered together, angular debris increased markedly between A.D. 550 to 750 and A.D. 700 to 880. After A.D. 880 the proportion of angular debris increased gradually. The relative proportion of debitage to tools also increased over time. However, these trends disappeared when survey areas were considered separately. Next, spatial variation between survey areas was also noted. Specifically, the debitage to tool ratio from the Kin Bineola area was lower than the ratios from the South Addition and Chacra Mesa survey areas during the A.D. 890 to 1025 period. Finally, the formal to informal tool ratio at Chacoan structures is lower than the ratios of other structural sites and will be examined more fully below.
Analysis of Tools
¶ 89 Temporal and spatial comparison of tool assemblages addresses several issues. First, the probable cultural affiliation of the Other/Unknown assemblages, in particular the Archaic/Anasazi is discussed. Second, variability in the tool assemblages of specific feature and site types is examined. As in the debitage analysis, pithouses, large structures, Chacoan structures and other architectural units are compared. Comparisons of single site types such as camps and small structures are also examined by survey area. Finally, temporal changes within the Anasazi time periods are examined.
Method Used in Tool Analysis
¶ 90 Appendix 5.4 gives a brief description of the tool types which were recorded during the inventory survey. Cumulative frequency graphs are used to graphically compare tool assemblages. The graphs (Figures 5.4-5.14) are structured with tool types along the x- axis and percentages along the y-axis. Tool types are cumulatively ordered from types with least to greatest amount of reduction undertaken on the tool, that is, utilized and retouched pieces underwent little reduction, in contrast to projectile points and bifaces. Hammerstones were simply added onto the end of the tool type sequence. For each tool assemblage, the percentages of various tool types are added and plotted sequentially as they appear on the x- axis. In other words, the percentage of utilized/retouched pieces are plotted, then the percentage of scrapers is added and plotted, etc. In the end, the frequencies of the total tool assemblage add up to 100 percent. The assemblages are then evaluated by comparing the lines plotted on the graphs. Tool assemblages which form lines with similar morphologies are interpreted as having comparable functions.
Total Tool Assemblage
¶ 91 Table 5.26 lists the entire assemblage of chipped stone tools and hammerstones which were recorded during the Inventory Survey. The manner in which tool types were grouped for this analysis is also listed. Overall, utilized/retouched pieces are the most common tool type recorded, while bifaces were the least common (Table 5.35).
¶ 92 Figure 5.4 illustrates variation in the tool assemblages from each survey area. Assemblages from Chacra Mesa and Kin Bineola are similar, and assemblages from the South Addition and Kin Klizhin differ from each other and from the two other areas. The South Addition and Kin Klizhin assemblages contain more hammerstones and fewer utilized/retouched flakes. The differences in the Kin Klizhin tool assemblages may have been created by methodological problems (see Appendix 5.3 for further discussion). The differences in tool assemblages between the four survey areas are addressed in greater detail in the section on site type.
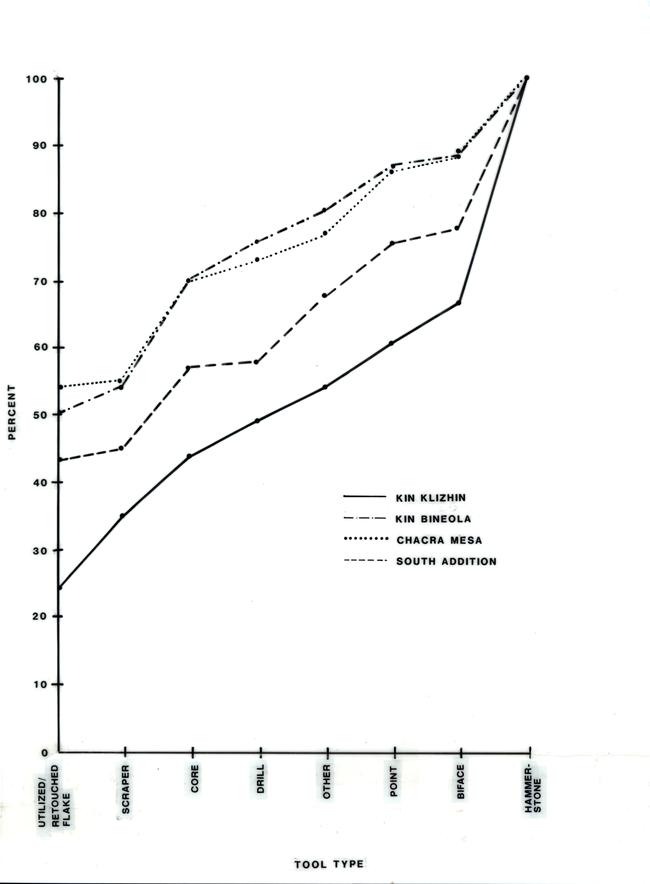 |
Figure 5.4. Total assemblage tool type percents by survey area. |
Temporal Variation in Tool Assemblage by Culture
¶ 93 Figure 5.5 shows the cumulative frequency graphs of tool assemblages for each cultural designation discussed in this analysis. No one assemblage is clearly separate from the other assemblages; however, some interesting patterns do emerge. In particular, the Archaic/Anasazi assemblage, a subdivision of the Other/Unknown category, is least like the Archaic assemblage. The Archaic sites contain 15 percent fewer utilized/retouched pieces and a higher relative proportion of projectile points (Table 5.35) than Archaic/Anasazi sites.
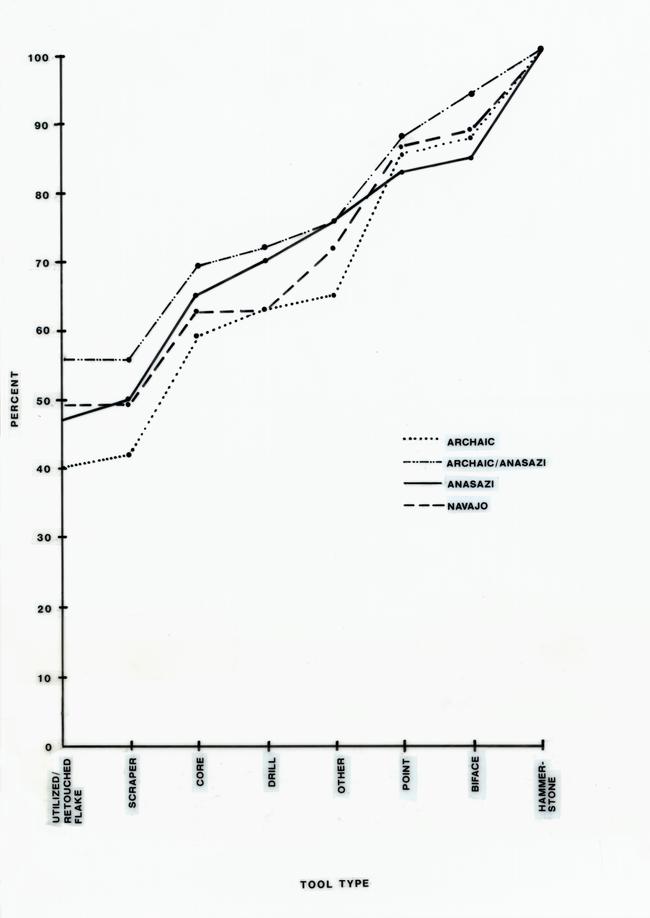 |
Figure 5.5. Tool type percents by culture (see also Table 5.35). |
¶ 94 Examination of sites from Chacra Mesa and the grouped site type camp helps to further clarify the issue of how to classify the Other/Unknown sites, in particular the Archaic/Anasazi sites. Chacra Mesa contains 95 percent of the total Other/Unknown lithics. The majority of this chipped stone material was found in large scatters on the top of the mesa. Figure 5.6 shows that on Chacra Mesa Archaic assemblages are distinct from the Other/Unknown and Anasazi tool assemblages. Although the Archaic sample size is small (n=34), the tool assemblages (Table 5.53) follow the general pattern described above for all Archaic sites recorded by the survey. Specifically, the Chacra Mesa Archaic contains fewer utilized/retouched pieces and more projectile points than assemblages from other cultures. The Other/Unknown sites are very similar to the Anasazi assemblage which contains a higher proportion of utilized/retouched pieces and fewer bifacially worked tools. Hence, the large lithic scatters on top of Chacra Mesa contain a tool assemblage which more closely resembles the Anasazi assemblage than the Archaic.
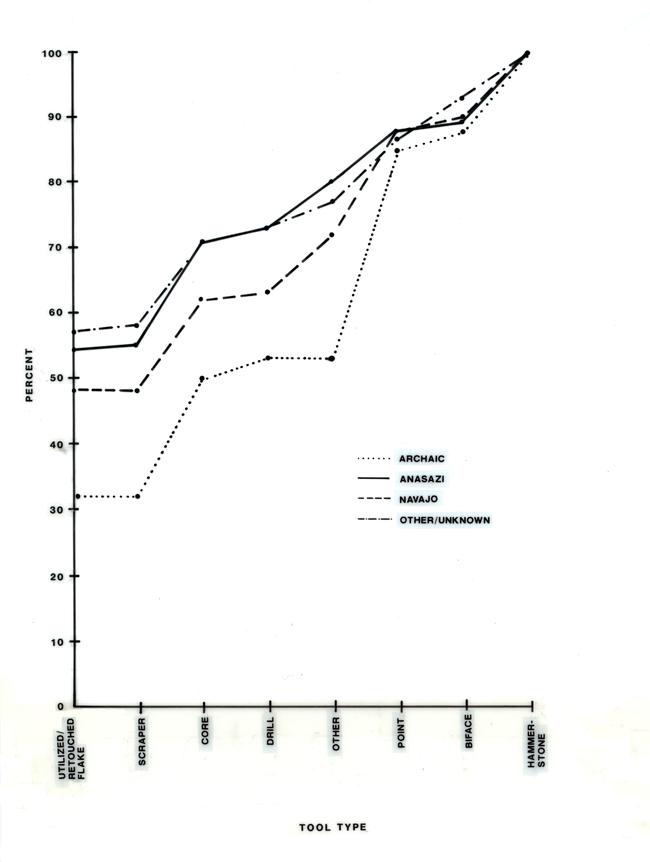 |
Figure 5.6. Chacra Mesa tool type percents by culture (see also Table 5.53) |
|
Table 5.53. Tool type percentages at sites in the Chacra Mesa survey area from Anasazi, Navajo, Archaic, and Other/Unknown cultures. |
||||||||
|---|---|---|---|---|---|---|---|---|
| Culture | ||||||||
| Anasazi | Navajo | Archaic | Other/Unknown | |||||
| Tool Type | No. | % | No. | % | No. | % | No. | % |
| Core | 143 | 15.8 | 26 | 14.4 | 6 | 17.6 | 62 | 13.4 |
| Utilized/retouched flake | 489 | 53.9 | 87 | 48.1 | 11 | 32.4 | 262 | 56.7 |
| Point | 69 | 7.6 | 29 | 16.0 | 11 | 32.4 | 56 | 12.1 |
| Scraper | 11 | 1.2 | - | - | - | - | 3 | 0.6 |
| Biface | 13 | 1.4 | 3 | 1.7 | 1 | 2.9 | 20 | 4.3 |
| Drill | 41 | 4.5 | 1 | 0.6 | 1 | 2.9 | 11 | 2.4 |
| Hammerstone | 104 | 11.5 | 19 | 10.5 | 4 | 11.8 | 32 | 6.9 |
| Other | 37 | 4.2 | 16 | 8.8 | - | - | 16 | 3.5 |
| TOTAL | 907 | 181 | 34 | 462 | ||||
¶ 95 Camp sites were examined from all culture types as another means of addressing the question of the cultural affiliation of Other/Unknown sites (Table 5.54). Figure 5.7 shows that the tool assemblage from Archaic camps is distinct from assemblages of all other camps. Furthermore, as in the previous comparisons, tool assemblages from Other/Unknown camps are more like assemblages from Anasazi and Navajo camps than like those of the Archaic. This pattern suggests that the majority of Other/Unknown sites are part of the Anasazi or possibly Navajo subsistence-settlement patterns rather than the Archaic.
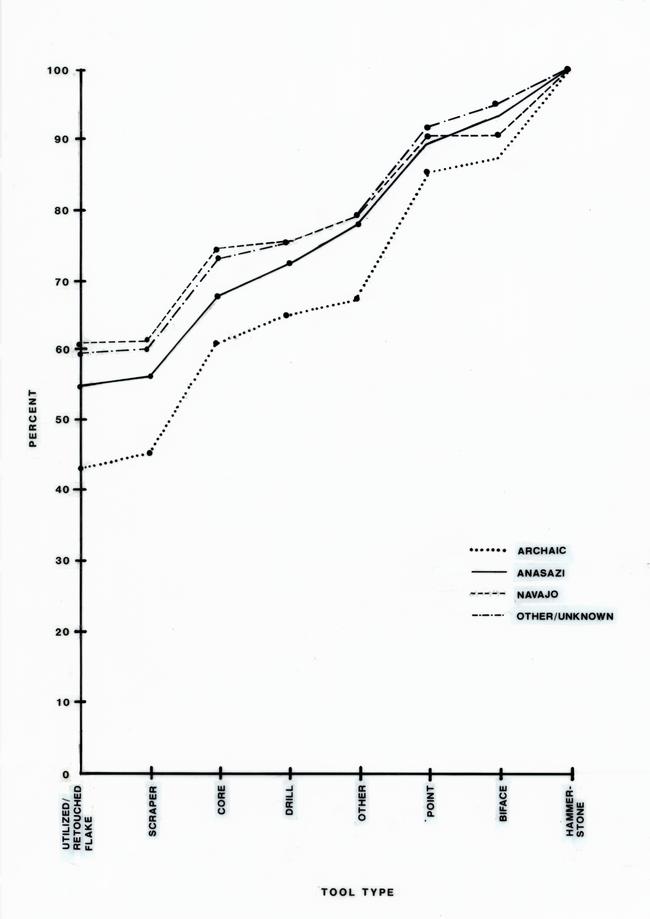 |
Figure 5.7. Camp tool percents by culture (see also Table 5.54). |
|
Table 5.54. Tool type percentages at camps by culture. |
||||||||
|---|---|---|---|---|---|---|---|---|
| Culture | ||||||||
| Anasazi | Navajo | Archaic | Other/Unknown | |||||
| Tool Type | No. | % | No. | % | No. | % | No. | % |
| Core | 30 | 12.0 | 9 | 12.7 | 8 | 16.3 | 42 | 12.7 |
| Utilized/Retouched Flake | 138 | 55.0 | 43 | 60.6 | 21 | 42.9 | 196 | 59.0 |
| Point | 27 | 10.8 | 8 | 11.3 | 9 | 18.4 | 39 | 11.7 |
| Scraper | 4 | 1.6 | 0 | 0 | 1 | 2.0 | 2 | 0.6 |
| Biface | 10 | 4.0 | 0 | 0 | 1 | 2.0 | 15 | 4.5 |
| Drill | 11 | 4.4 | 1 | 1.4 | 2 | 4.0 | 7 | 2.1 |
| Hammerstone | 17 | 6.8 | 7 | 9.9 | 6 | 12.2 | 18 | 5.4 |
| Other | 14 | 5.6 | 3 | 4.2 | 1 | 2.0 | 13 | 3.9 |
| TOTAL | 251 | 71 | 49 | 332 | ||||
Spatial Distribution of Tools by Grouped Site Types
¶ 96 The tool assemblages from grouped Anasazi site types vary (Figure 5.8). For the purpose of this analysis, Chacoan structures and great kivas are treated separately. Assemblages from Chacoan structures differ from those of other site types. Almost 80 percent of the assemblage from Chacoan structures is comprised of utilized/retouched pieces and cores (Table 5.42). The remaining grouped site types contain a greater diversity of tool types. Diversity, specifically evenness, was calculated, using techniques developed by Kintigh (1984), for all site types and supports the observation that the tool assemblages from Chacoan structures are less diverse than others (see Table 5.55 for data and a discussion of methods). This pattern is counter-intuitive. If one of the functions of Chacoan structures was habitation by a relatively large number of people, then one would expect the tool assemblage to reflect a wide range of activities (Whittlesey 1982) and to be similar to the assemblages from other types of habitation sites. Moreover, if Chacoan structures also performed ritual functions in which stone tools may have been used for making ornaments or preparing food, the tool assemblage from these sites should be at least as diverse as those of great kivas. However, Figure 5.8 and Table 5.42 show that the tool assemblage from Chacoan structures is even less diverse than at great kivas. Whatever functions were performed at Chacoan structures, they required few formally shaped tools. Another possible explanation is that the formal tools were pocketed by visitors to these large sites or that they have been scavenged in recent centuries by Navajos living in the area.
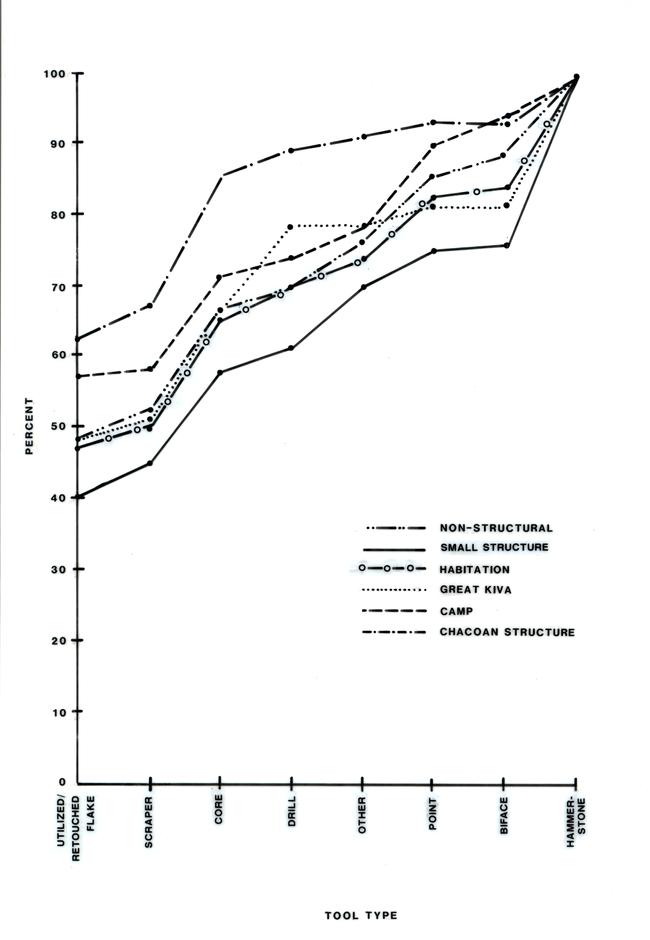 |
Figure 5.8. Major Anasazi site type tool percents (see also Table 5.42). |
|
Table 5.55. Diversity calculations for Anasazi site types.a |
|
|---|---|
| Site Type | Diversityb |
| Large structure | 0.8217 |
| Chacoan structure | 0.6014 |
| Great kiva | 0.6957 |
| Small structure | 0.7840 |
| Nonstructural | 0.7934 |
| aData
for calculations from Table 5.42. bThe diversity of tool types was calculated using a formula from Zar (1974): fi=frequency of categories I (number of tools for each type in this case) k=number of categories (8 tool types) n=sample size (total number of tools recorded for a site group) This formula measures evenness. If all the tool categories had the same quantity of tools in them the J score would be 1.0. See Reid (1982) and Kintigh (1984) for a more complete description. |
|
¶ 97 The excavated sample from Pueblo Alto, a Chacoan structure in Chaco Canyon, is similar in some respects to the tool assemblages described from the Chacoan structures recorded by the additions survey. Cores and utilized/retouched pieces make up 95 percent of the tools from Pueblo Alto (Cameron 1987). This large number of utilized/retouched pieces was identified using a microscope in a laboratory setting. Consequently, more utilized pieces were identified than were recognized on the present survey. However, even if the actual number of utilized/retouched pieces is reduced by one half, this tool category would still comprise over 80 percent of the tool assemblage. Consequently, this excavated sample lends support to the idea that informal tools are a principal tool type in the assemblages from Chacoan structures. As is discussed in greater detail below, Chacoan structures in Chaco Canyon itself also contain a low diversity of tools.
¶ 98 Individual feature types were also merged into feature type groups (Table 5.56). Lithic assemblages from pithouses contain a higher proportion of utilized/retouched pieces and a lower proportion of hammerstones than assemblages from large structures.
|
Table 5.56. Tool type percentages at Anasazi feature types. |
||||||||
|---|---|---|---|---|---|---|---|---|
| Feature Type | ||||||||
| Large Structure | Small Structure | Pithouse | Nonstructural | |||||
| Tool Type | No. | % | No. | % | No. | % | No. | % |
| Core | 134 | 15.5 | 33 | 15.2 | 35 | 11.1 | 88 | 15.4 |
| Utilized/retouched flake | 392 | 45.5 | 68 | 31.3 | 195 | 61.7 | 279 | 48.7 |
| Point | 50 | 5.8 | 12 | 5.5 | 21 | 6.6 | 47 | 8.2 |
| Scraper | 38 | 4.4 | 10 | 4.6 | 3 | 0.9 | 15 | 2.6 |
| Biface | 13 | 1.5 | 1 | 0.5 | 5 | 1.6 | 15 | 2.6 |
| Drill | 46 | 5.3 | 7 | 3.2 | 18 | 5.7 | 25 | 4.4 |
| Hammerstone | 157 | 18.2 | 63 | 29.0 | 22 | 7.0 | 67 | 11.7 |
| Other | 33 | 3.8 | 23 | 10.6 | 17 | 5.4 | 37 | 6.5 |
| TOTAL | 863 | 217 | 316 | 573 | ||||
¶ 99 Of the different site types, tool assemblages from small structures showed the most interesting differences by survey area (Figure 5.9). In particular, the Kin Bineola area small structures differed from those of other survey areas. Over half the tool assemblage from these sites was made up of utilized and retouched pieces and the proportion of hammerstones was substantially lower than other survey areas (Table 5.57). Interestingly, relatively little groundstone was found at the small structures in Kin Bineola (see Groundstone, Minerals, and Ornaments section). These patterns suggest that the activities that occurred at small structures in the Kin Bineola area may have differed from the activities performed at this type of site in the other survey areas.
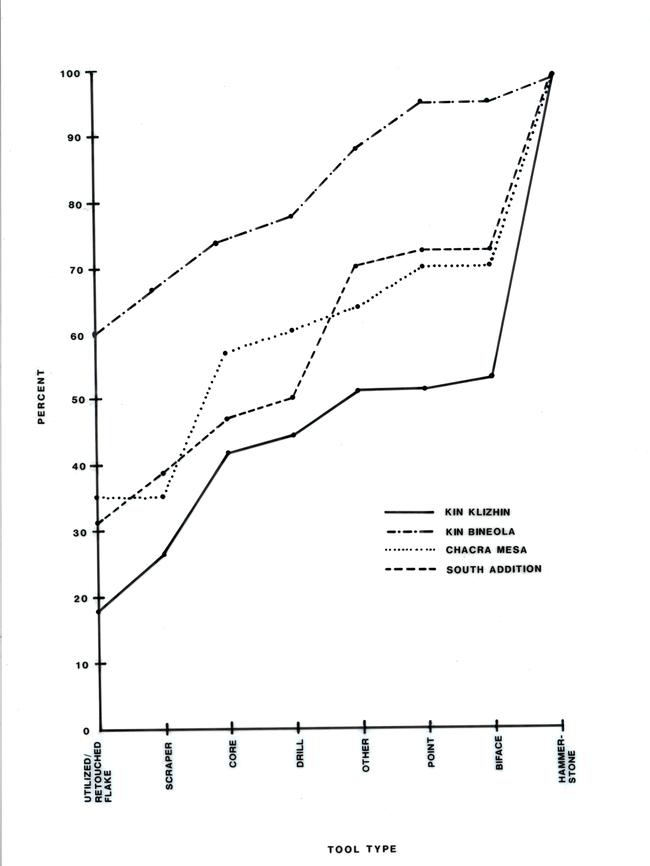 |
Figure 5.9. Small structure tool type percents by survey area (see also Table 5.57). |
|
Table 5.57. Tool assemblages from small structures from the survey areas. |
||||||||
|---|---|---|---|---|---|---|---|---|
| Survey Area | ||||||||
| Chacra Mesa | Kin Bineola | Kin Klizhin | South Addition | |||||
| Tool Type | No. | % | No. | % | No. | % | No. | % |
| Core | 16 | 22.5 | 5 | 6.5 | 7 | 15.6 | 3 | 7.7 |
| Utilized/retouched flake | 25 | 35.2 | 46 | 59.7 | 8 | 17.8 | 12 | 30.8 |
| Point | 4 | 5.6 | 5 | 6.5 | 0 | 0 | 1 | 2.6 |
| Scraper | 0 | 0 | 5 | 6.5 | 4 | 8.9 | 3 | 7.7 |
| Biface | 0 | 0 | 0 | 0 | 1 | 2.2 | 0 | 0 |
| Drill | 2 | 2.8 | 3 | 3.9 | 1 | 2.2 | 1 | 2.6 |
| Hammerstone | 21 | 29.6 | 5 | 6.5 | 21 | 46.7 | 11 | 28.2 |
| Other | 3 | 4.2 | 8 | 10.4 | 3 | 6.7 | 8 | 20.5 |
| TOTAL | 71 | 77 | 45 | 39 | ||||
Temporal Variation of the Tool Assemblage at Dated Anasazi Sites
¶ 100 The tool assemblages from Anasazi sites which could be placed into time groups show some temporal trends (Table 5.58). The increase in the percentage of hammerstones over time is the most striking change (Figure 5.10).
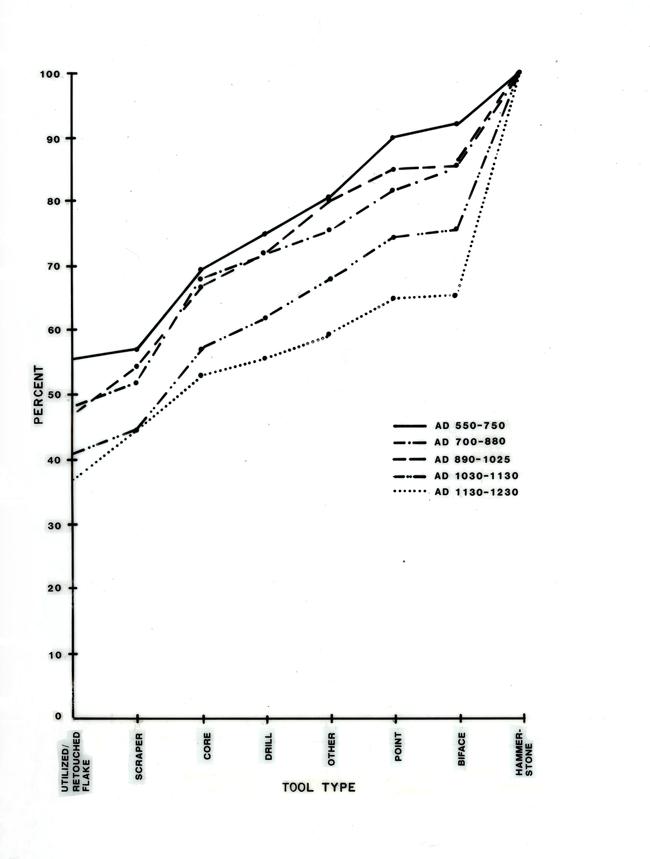 |
Figure 5.10. Anasazi tool type percents by time group (see also Table 5.58). |
|
Table 5.58. Tool type percentages from the Anasazi time periods. |
||||||||||
|---|---|---|---|---|---|---|---|---|---|---|
| Time Period | ||||||||||
| A.D. 550-750 |
A.D. 700-880 |
A.D. 890-1025 |
A.D. 1030-1130 |
A.D. 1130-1230 |
||||||
| Tool Type | No. | % | No. | % | No. | % | No. | % | No. | % |
| Core | 50 | 12.1 | 25 | 15.9 | 34 | 12.5 | 62 | 13.9 | 10 | 9.3 |
| Utilized/retouched flake | 230 | 55.7 | 75 | 47.7 | 128 | 47.1 | 185 | 41.5 | 40 | 37.4 |
| Point | 36 | 8.7 | 9 | 5.7 | 13 | 4.8 | 29 | 6.5 | 7 | 6.5 |
| Scraper | 5 | 1.2 | 7 | 4.5 | 20 | 7.4 | 14 | 3.1 | 8 | 7.5 |
| Biface | 6 | 1.5 | 6 | 3.8 | 3 | 1.1 | 9 | 2.0 | 1 | 0.9 |
| Drill | 25 | 6.1 | 7 | 4.5 | 15 | 5.5 | 18 | 4.0 | 3 | 2.8 |
| Hammerstone | 35 | 8.5 | 22 | 14.0 | 38 | 14.0 | 101 | 22.6 | 35 | 32.7 |
| Other | 26 | 6.3 | 6 | 3.8 | 21 | 7.7 | 28 | 6.3 | 3 | 2.8 |
| TOTAL | 413 | 157 | 272 | 446 | 107 | |||||
¶ 101 This patterning is not as distinct when the tool assemblages from survey areas are examined individually (Tables 5.59-5.62). Unfortunately, only Kin Bineola and Chacra Mesa contained adequate sample sizes for comparisons within areas. The tool assemblages from these two areas do not clearly mirror the general temporal pattern seen in Figure 5.10. At Chacra Mesa, the earliest time period (A.D. 550-750) has the largest tool assemblage due to the substantial Basketmaker III population centered on Shabik’eschee Village. Assemblages in subsequent periods, including the A.D. 1030-1130 interval are substantially smaller (Table 5.59, Figure 5.11). Although the smaller tool assemblages from the later periods make comparison difficult, it is clear that utilized and retouched flakes make up a larger proportion of this early assemblage than they do of assemblages in subsequent intervals. At Kin Bineola, the two time groups which are least alike are consecutive: A.D. 890 to 1025 and 1030 to 1130 (Figure 5.12, Table 5.60). Consequently, the significance of the general temporal pattern seen in Figure 5.10 is unclear.
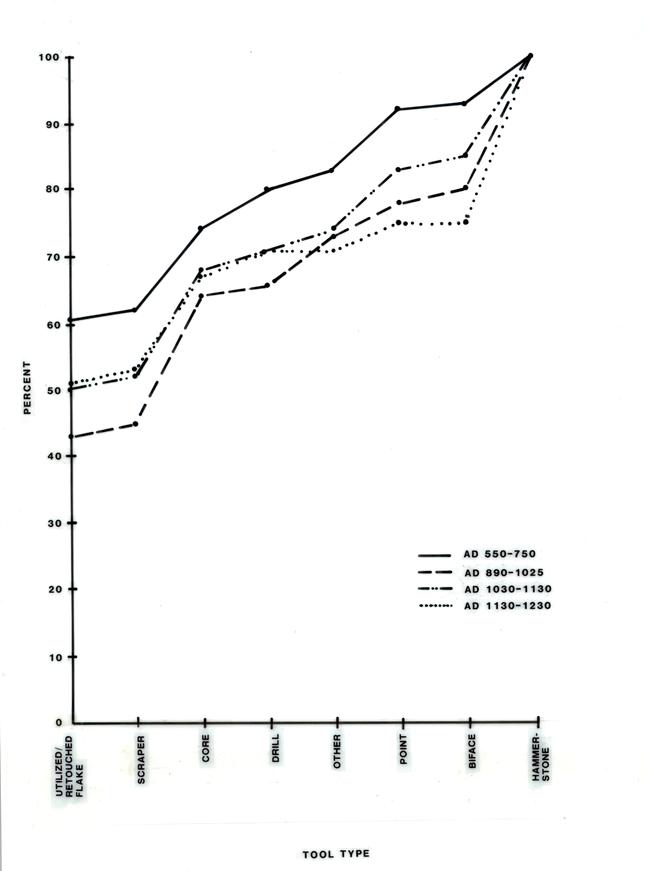 |
Figure 5.11. Chacra Mesa Anasazi tool type percents by time group (see also Table 5.59). |
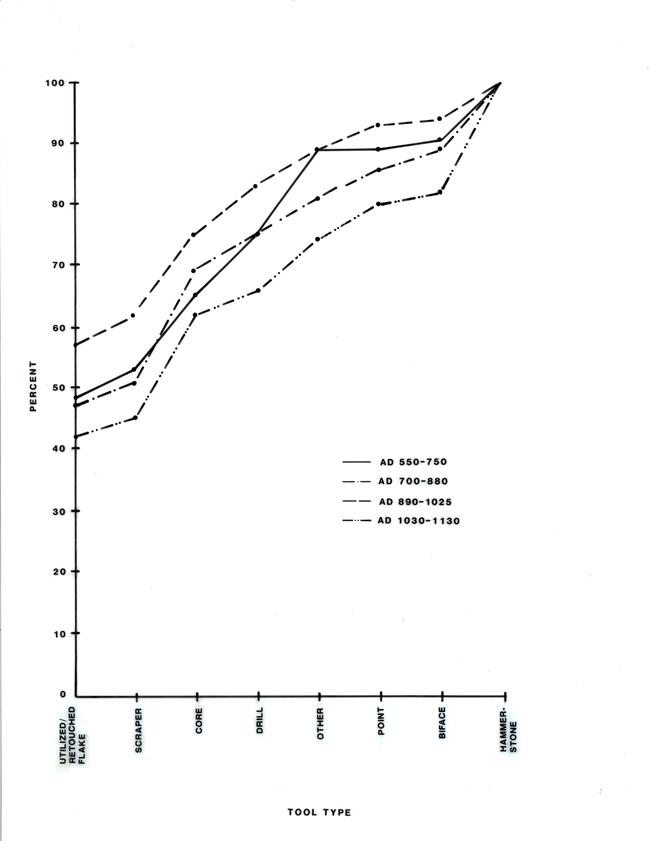 |
Figure 5.12. Kin Bineola Anasazi tool type percents by time group (see also Table 5.60). |
|
Table 5.59. Tool type percentages at sites in the Chacra Mesa survey area from the Anasazi time groups. |
||||||||||
|---|---|---|---|---|---|---|---|---|---|---|
| Time Period | ||||||||||
| A.D. 550-750 |
A.D. 700-880 |
A.D. 890-1025 |
A.D. 1030-1130 |
A.D. 1130-1230 |
||||||
| Tool Type | No. | % | No. | % | No. | % | No. | % | No. | % |
| Core | 40 | 12.0 | - | - | 8 | 19.0 | 22 | 16.1 | 7 | 13.7 |
| Utilized/retouched flake | 204 | 61.3 | 18 | 90.0 | 18 | 42.9 | 68 | 49.6 | 26 | 51.0 |
| Point | 31 | 9.3 | 1 | 5.5 | 2 | 4.7 | 13 | 9.5 | 2 | 3.9 |
| Scraper | 2 | 0.6 | - | - | 1 | 2.4 | 2 | 1.5 | 1 | 2.0 |
| Biface | 3 | 0.9 | 1 | 5.5 | 1 | 2.4 | 2 | 1.5 | - | - |
| Drill | 19 | 5.7 | - | - | 1 | 2.4 | 4 | 2.9 | 2 | 3.9 |
| Hammerstone | 23 | 6.9 | - | - | 8 | 19.0 | 22 | 16.1 | 13 | 25.5 |
| Other | 11 | 3.3 | - | - | 3 | 7.1 | 4 | 2.9 | - | - |
| TOTAL | 333 | 20 | 42 | 137 | 51 | |||||
|
Table 5.60. Tool type percentages at sites in the Kin Bineola survey area from the Anasazi time groups. |
||||||||||
|---|---|---|---|---|---|---|---|---|---|---|
| Time Period | ||||||||||
| A.D. 550-750 |
A.D. 700-880 |
A.D. 890-1025 |
A.D. 1030-1130 |
A.D. 1130-1230 |
||||||
| Tool Type | No. | % | No. | % | No. | % | No. | % | No. | % |
| Core | 5 | 11.9 | 18 | 18.4 | 21 | 13.2 | 29 | 16.6 | - | - |
| Utilized/retouched flake | 20 | 47.6 | 46 | 46.9 | 90 | 56.6 | 74 | 42.3 | 5 | 62.5 |
| Point | - | - | 5 | 5.1 | 6 | 3.8 | 11 | 6.3 | 1 | 12.5 |
| Scraper | 2 | 4.8 | 4 | 4.1 | 8 | 5.0 | 5 | 2.9 | - | - |
| Biface | 1 | 2.4 | 3 | 3.1 | 1 | 0.6 | 3 | 1.7 | - | - |
| Drill | 4 | 9.5 | 6 | 6.1 | 13 | 8.2 | 7 | 4.0 | - | - |
| Hammerstone | 4 | 9.5 | 10 | 10.2 | 10 | 6.3 | 32 | 18.3 | - | - |
| Other | 6 | 14.3 | 6 | 6.1 | 10 | 6.3 | 14 | 8.0 | 2 | 25.0 |
| TOTAL | 42 | 98 | 159 | 175 | 8 | |||||
|
Table 5.61. Tool type percentages at sites in the Kin Klizhin survey area from the Anasazi time groups. |
||||||||||
|---|---|---|---|---|---|---|---|---|---|---|
| Time Period | ||||||||||
| A.D. 550-750 |
A.D. 700-880 |
A.D. 890-1025 |
A.D. 1030-1130 |
A.D. 1130-1230 |
||||||
| Tool Type | No. | % | No. | % | No. | % | No. | % | No. | % |
| Core | - | - | 5 | 21.7 | 2 | 6.7 | 8 | 8.4 | 3 | 6.3 |
| Utilized/retouched flake | 1 | 16.7 | 4 | 17.4 | 3 | 10.0 | 21 | 22.1 | 9 | 18.8 |
| Point | 1 | 16.7 | 1 | 4.3 | 3 | 10.0 | 3 | 3.2 | 4 | 8.3 |
| Scraper | - | - | 1 | 4.3 | 9 | 30.0 | 7 | 7.4 | 7 | 14.6 |
| Biface | - | - | 2 | 8.7 | 1 | 3.3 | 4 | 4.2 | 1 | 2.1 |
| Drill | 1 | 16.7 | 1 | 4.3 | 1 | 3.3 | 6 | 6.2 | 1 | 2.1 |
| Hammerstone | 3 | 50.0 | 9 | 39.1 | 11 | 36.7 | 38 | 40.0 | 22 | 45.8 |
| Other | - | - | - | - | - | - | 8 | 8.4 | 1 | 2.1 |
| TOTAL | 6 | 23 | 30 | 95 | 48 | |||||
|
Table 5.62. Tool type percentages at sites in the South Addition survey area from the Anasazi time groups. |
||||||||
|---|---|---|---|---|---|---|---|---|
| Time Group | ||||||||
| A.D. 550-750 |
A.D. 700-880 |
A.D. 890-1025 |
A.D. 1030-1130 |
|||||
| Tool Type | No. | % | No. | % | No. | % | No. | % |
| Core | 5 | 18.5 | 2 | 14.3 | 3 | 7.1 | 3 | 7.7 |
| Utilized/retouched flake | 5 | 18.5 | 7 | 50.0 | 17 | 40.5 | 22 | 56.4 |
| Point | 4 | 14.8 | 2 | 14.3 | 2 | 4.8 | 2 | 5.1 |
| Scraper | 1 | 3.7 | - | - | 2 | 4.8 | - | - |
| Biface | 2 | 7.4 | - | - | - | - | - | - |
| Drill | 1 | 3.7 | - | - | - | - | 1 | 2.6 |
| Hammerstone | 5 | 18.5 | 3 | 21.0 | 9 | 21.4 | 9 | 23.1 |
| Other | 4 | 14.8 | - | - | 9 | 21.4 | 2 | 5.1 |
| TOTAL | 27 | 14 | 42 | 39 | ||||
¶ 102 Comparing time groups between survey areas, only two time periods (A.D. 890 to 1025 and A.D. 1030 to 1130) yielded adequate sample sizes (Figures 5.13 and 5.14). Between A.D. 890 to 1025, Chacra Mesa and the South Addition contain fairly similar tool assemblages, with some difference in the proportions of cores and the “other” tool category (Figure 5.13, Tables 5.59 and Table 5.62). Kin Bineola is distinct from the other two survey areas. By A.D. 1030 to 1130, the tool assemblages from the Kin Bineola and Chacra Mesa survey areas are very similar (Figure 5.14, Table 5.60). The similarity in the tool assemblages from these two areas is created principally by a change in the Kin Bineola assemblage. In particular, the later period in this area contains fewer utilized/retouched pieces and a higher percentage of hammerstones (Table 5.60). At Chacra Mesa, the tool assemblages are fairly consistent between these two time periods, with the major difference created by a slight increase in the proportion of utilized/retouched pieces in the later period (Table 5.59). The change in the tool assemblage at Kin Bineola between A. D. 890 to 1025 and A.D. 1030 to 1130 may indicate a change in the utilization of the area. As seen in the debitage analysis, the proportions of flake types (Table 5.48) and the formal to informal tool ratios (Table 5.51) do not change significantly between these two periods at Kin Bineola. However, the number of flakes for each tool increase from 6.7 to 15.5 (Table 5.51). These data along with the increased number of hammerstones suggest that raw material may have been reduced more frequently at Kin Bineola between A.D. 1030 and 1130 than it was before.
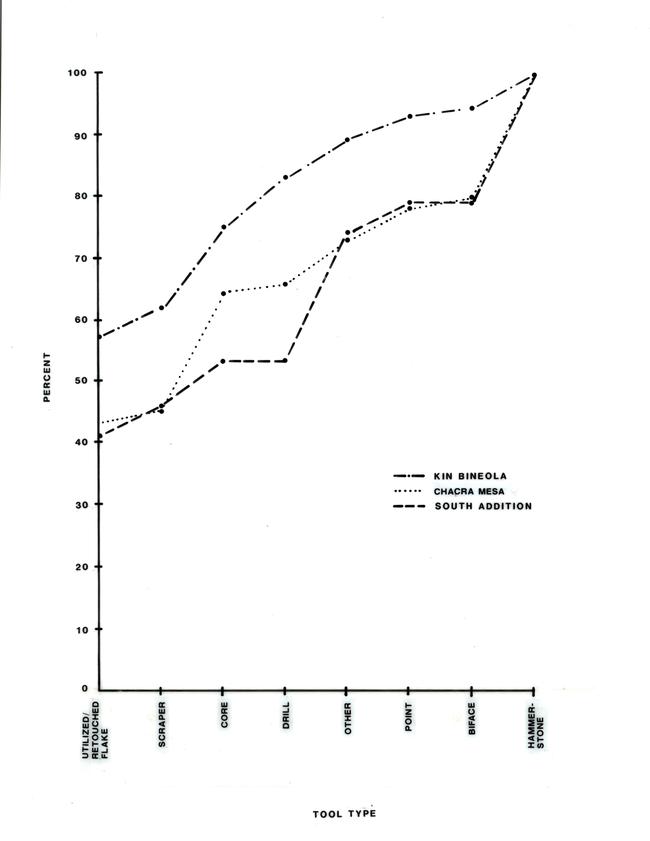 |
Figure 5.13. A.D. 890-1025 tool type percents by survey area (see also Tables 5.59, 5.60, 5.62). |
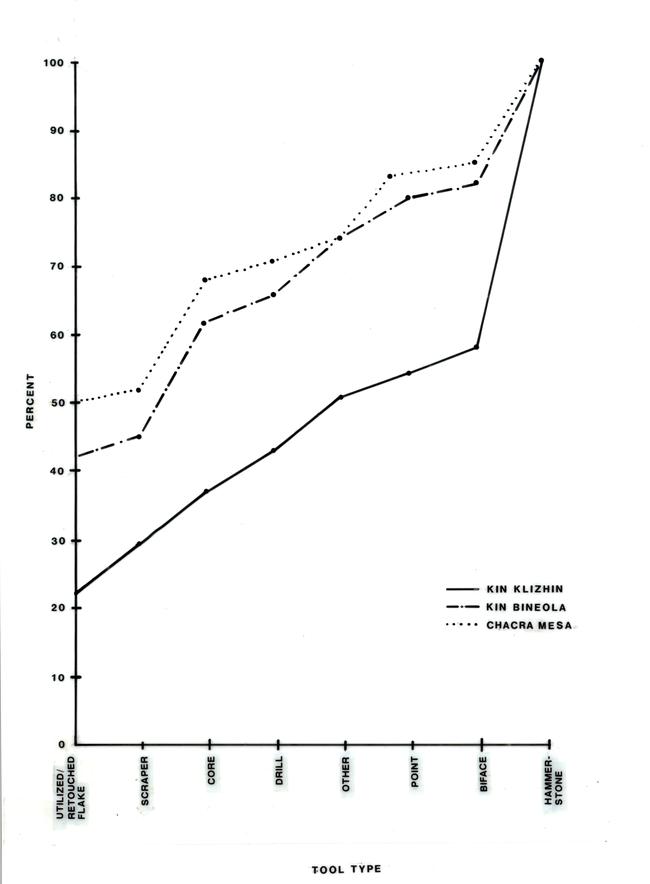 |
Figure 5.14. A.D. 1030-1130 tool type percents by survey area (see also Tables 5.59, 5.60 and 5.61). |
Summary of Tool Assemblage
¶ 103 Analysis of the tool assemblages indicates that those from Archaic sites are distinct from those of other cultures. In addition, Other/Unknown assemblages more closely resemble those of Anasazi sites than those of Archaic sites. Consequently, the majority of lithic scatters on Chacra Mesa, as well as camps from all areas which could not be given a clear cultural affiliation, are probably part of the Anasazi settlement and subsistence system.
¶ 104 Tool assemblages from Chacoan structures contain a surprisingly low diversity of tools. These assemblages were expected to be similar to habitation sites and possibly to great kivas but instead contained more informal tools and very few formally shaped tools. In addition, the tool assemblage from an excavated Chacoan structure in Chaco Canyon (Pueblo Alto) showed a similar pattern.
¶ 105 Small structures in the Kin Bineola area have a high proportion of informal tools, as well as the highest proportion of formal tools of the four areas (Table 5.57). In contrast, the Kin Bineola small structures display the smallest percentages of cores and hammerstones of any of the four areas, suggesting that despite the frequency of tools, that little tool production occurred at these sites.
¶ 106 The tool assemblage from Kin Bineola was also interesting from a temporal perspective. An increase in the proportion of hammerstones along with a jump in the debitage to tool ratio occurred between A.D. 890 to 1025 and A.D. 1030 to 1130. It is important to note that hammerstones may have been used not only for the shaping of chipped stone but also for shaping tabular sandstone for architectural purposes. The higher frequencies of hammerstones are correlated with increased puebloan construction activities.
Collected Early Projectile Points
¶ 107 Eleven projectile points, which have been classified as PaleoIndian (n=2) or Archaic (n=9), were collected by the inventory survey. The PaleoIndian projectile points are shown in Figure 5.15. Both were found on Chacra Mesa. Point A has been identified as a possible Agate Basin base, and was found in a lithic scatter which was part of a trail on Chacra Mesa. The site also contained a Navajo component. The point is made of miscellaneous (fossiliferous) chert. Point B is a Plainview or Belen base and was found as an isolated artifact; it is made of chalcedony which has been heavily patinated. Figure 5.16 displays the clearly identifiable Archaic points. Point C is identified as a possible reworked Jay point made of basalt. Points D and E are Bajada points and are made of an unknown nonlocal chert and basalt, respectively. Points F and G are San Jose points. Point F is made of obsidian, and Point G is made of miscellaneous (fossiliferous) chert. Figure 5.17 shows the points that are possibly Archaic but for which identification was problematic. Point H is a probable Middle Archaic point, possibly San Jose, and is made of obsidian. Point I is a possible Late Archaic point made of sandstone from the Morrison Formation (Nacimiento). Point J is an indeterminate Archaic point, manufactured of chert. Finally, Point K is a possible Late Archaic or Basketmaker point of obsidian.
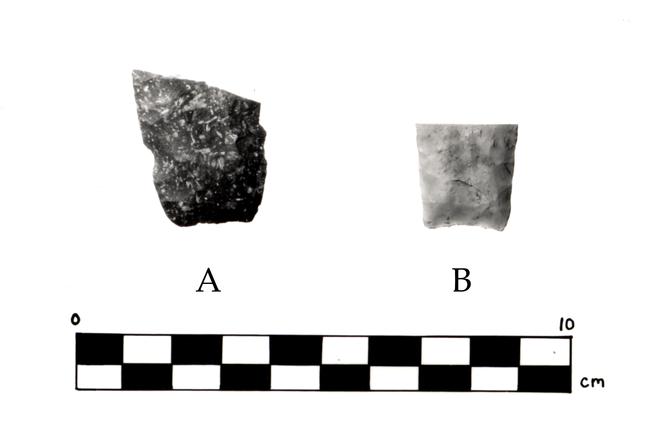 |
Figure 5.15. Projectile points A and B. |
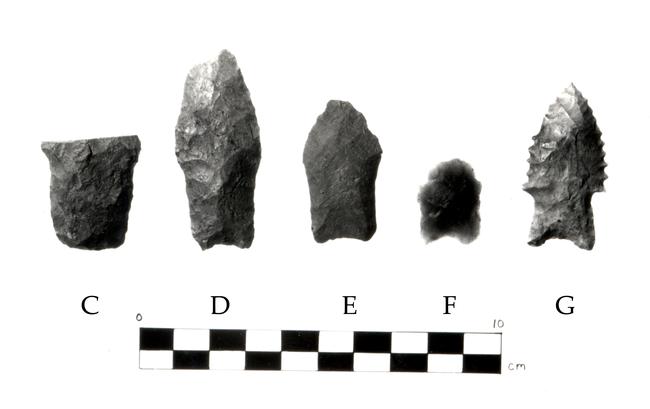 |
Figure 5.16. Projectile points C through G. |
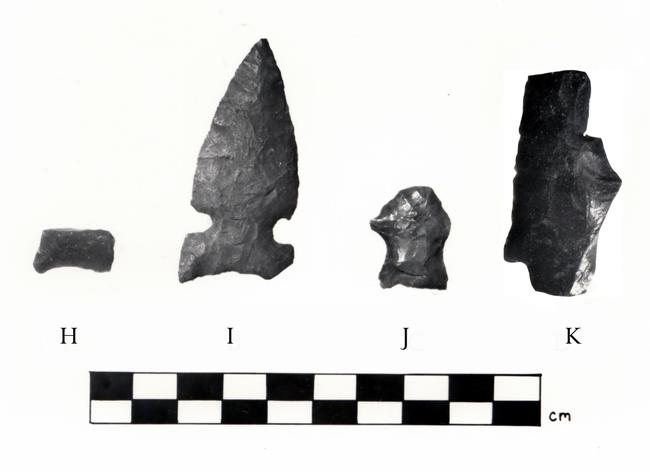 |
Figure 5.17. Projectile points H through K. |
Comparison with Other Studies in the San Juan Basin
¶ 108 Temporal variation has been the main focus of studies which examined technological aspects of chipped stone in the San Juan Basin. Most studies have emphasized the distinction between formal tool manufacture and flake tool production. As mentioned above, this distinction has been recognized as generally characterizing the differences between Anasazi and Archaic chipped stone technologies. A general summary of the methods used and results obtained by various studies to assess the issue of changes in stone tool manufacture of the San Juan Basin area is available in Simmons (1982:989).
¶ 109 Simmons (1982) further compares his work on lithic materials from the Adapt I Project (located on Alemita Wash) and the Bis sa'ani community (located north of Chaco Canyon). He finds that the Archaic lithic assemblages from the Alemita Wash area contained less cortex than the Anasazi assemblages from the Bis sa'ani area. In addition, a higher proportion of debitage compared to the quantity of cores was found at Archaic sites. Anasazi assemblages from the Alemita Wash area and the Bis sa'ani community were similar in that both emphasize informal tool production or fairly expedient technologies.
¶ 110 Temporal variation in Archaic and Anasazi lithic technologies from both of Simmons’ studies are comparable to the findings of the Additions Survey. Although these studies use different methods of examining reduction techniques (Simmons examining amount of cortex while the present study analyzes the proportion of biface thinning flakes), similar results were obtained. Both studies conclude that Archaic assemblages stress formal tool manufacture and use, while Anasazi assemblages emphasize informal tools and expedient technologies.
¶ 111 The issue of spatial variation in chipped stone manufacture and use are addressed by Simmons (1982:1002-1005) in the Bis sa'ani community and by Cameron (1997) in a study of Chaco Canyon. Both studies examined excavated materials; and, hence, conclusions based on comparisons between these studies and the surface survey data from the Additions Survey must be viewed with caution.
¶ 112 According to Simmons the lithic assemblage from Bis sa'ani Pueblo contains less debitage, a higher proportion of tools, and more tool types than the smaller sites surrounding the Chacoan structure. In spite of these differences, Simmons concludes that little significant variation is present among site types and that retouched pieces constitute the major tool types in all Anasazi assemblages from the area.
¶ 113 These findings are interesting in contrast to the results of the Additions Survey. Assemblages from both the Bis sa'ani project and the current project contain large proportions of informal tools. This pattern seems to be in keeping with puebloan technologies in general. However, differences between the two study areas are seen in the assemblages from the Chacoan structures. Although Simmons does not calculate diversity indices, he implies that Bis sa'ani contains a higher diversity of tools, as seen in the wider variety of tool types, than do the small pueblos surrounding the Chacoan structure. In contrast, the Chacoan structures recorded on the Additions Survey have a low diversity of tools. In addition, based on the low percentage of debitage in the assemblage from Bis sa'ani, Simmons concluded that finished tools were brought into this structure and were not manufactured there. The relative proportion of debitage found at Chacoan structures in this study is not low and consequently does not follow the pattern noted by Simmons. Although the variation between the assemblages from Chacoan structures in the Bis sa'ani area and the inventory survey areas may be meaningful, differences in depositional contexts may also account for the variation. To illustrate, the majority of lithic materials from Bis sa'ani were from excavated rooms (Simmons 1982:Table 59). Most of the lithic materials from Chacoan structures on the Additions Survey were recorded from the surfaces of trash middens. Because waste flakes are more likely to have been thrown in trash dumps than left in room contexts, these depositional differences could account for the differences in frequencies of debitage. In summary, the general Anasazi tool assemblages from both areas stress informal tools. Assemblages from Bis sa'ani and from Chacoan structures on the Additions Survey areas may differ, but this variation may, in part, be a product of sampling different depositional contexts.
¶ 114 Cameron (1997) discusses spatial variation in the chipped stone assemblage from Chaco Canyon. She focuses her analysis on the difference between great houses (Chacoan structures in this chapter) and small houses (large structural sites in this chapter). Using only screened excavated samples, she concludes that Chacoan structures (specifically Pueblo Alto) and small houses contain similar proportions of debitage. However, the tool assemblages from the two site types differ. Those from Chacoan structures contain few tool types, and projectile points comprise a large proportion of the assemblage. In contrast, small houses contain a wider variety of tool types. Based on these findings, Cameron suggests that a limited range of activities occurred at Chacoan structures. Hence, the patterns of spatial variation recorded from Chaco Canyon nicely complement those found from sites recorded during the Additions Survey. Specifically, the tool assemblages from Chacoan structures in Chaco Canyon and in the survey areas are less variable than those of habitation sites. A possible explanation for this pattern is that the range of Chacoan structure activities requiring chipped stone materials was limited or did not require formally shaped tools.
Groundstone, Minerals, and Ornaments
¶ 115 Groundstone, minerals, and ornaments constitute the final artifact classes which are discussed in this chapter. Ratios are used to compare the total amount of chipped stone (tools and debitage) to the proportion of groundstone (manos and metates), minerals, and ornaments in various assemblages. Table 5.26 lists the various types of groundstone, minerals, and ornaments which were recorded during the course of the inventory survey.
¶ 116 In the total assemblage, approximately 35 pieces of chipped stone were found for every piece of groundstone. For every mineral, 57 pieces of chipped stone were recorded and 937 for every ornament (Table 5.63). Anasazi sites contain the majority of groundstone (86.4 percent of the total groundstone assemblage), minerals (92.5 percent), and ornaments (88.5 percent) recorded during the survey.
Table 5.63. Ratios of chipped stone to groundstone, minerals, and ornaments at Anasazi, Navajo, Archaic, Archaic/Anasazi, and Other/Unknown sites.
¶ 117 The Anasazi sites showed few clear temporal trends in the proportions of groundstone or ornaments (Table 5.64). The relative proportion of groundstone to chipped stone material increases after A.D. 750. This increase may be related to heavier reliance on agriculture after A.D. 700. A temporal increase in the relative proportion of minerals is also present. Specifically, the proportion of minerals recorded at sites increased greatly between A.D. 550 to 750 (one mineral for every 118.5 pieces of chipped stone recorded) and A.D. 700 to 880 (one mineral for every 33.8 pieces of chipped stone recorded), and then only gradually increases during the next four periods. The increasing ratio of minerals over time is also seen in the comparison of pithouse (which were most numerous in the A.D. 550 to 750 time group) and large structure feature types which were utilized primarily after A.D. 700 (Table 5.65).
Table 5.64. Ratios of chipped stone to groundstone, minerals, and ornaments from the Anasazi time periods.
|
Table 5.65. Ratios of chipped stone to groundstone, minerals, and ornaments by Anasazi feature type groups. |
||||||||
|---|---|---|---|---|---|---|---|---|
| Feature Type | ||||||||
| Large Structure | Small Structure | Pithouse | Nonstructural | |||||
| Artifact Type | No. | Ratio | No. | Ratio | No. | Ratio | No. | Ratio |
| Chipped
stone Groundstone Mineral Ornament |
8,279 337 257 15 |
24.6 32.2 551.9 |
1,721 88 47 3 |
19.6 36.6 573.7 |
2,534 52 19 2 |
48.7 133.4 1,267.0 |
4,887 128 70 3 |
38.2 69.8 1,629.0 |
¶ 118 Spatial differences are also interesting (Table 5.66). The South Addition contains the lowest ratio of groundstone to chipped stone, indicating that groundstone was more common in this survey area. Minerals are most common in the Kin Klizhin area; while ornaments were more often found at Kin Bineola.
Table 5.66. Ratios of all chipped stone to groundstone, minerals, and ornaments by survey area.
¶ 119 Small structures contained relatively higher frequencies of groundstone than any other Anasazi site type (Table 5.67). However, small structures in the Kin Bineola area did not follow this pattern (Table 5.68). The relatively low frequency of groundstone from small structures in the Kin Bineola area suggests that these sites may have been utilized for a different array of activities than small structures in the other survey areas. Finally, minerals were most common at Chacoan structures relative to chipped stone, while ornaments were proportionately more frequent at large structures which probably functioned as habitation sites (Table 5.67). In fact, no ornaments were found at Chacoan structures. If these sites were the focus of certain ritual activities (Judge 1989), ornaments might be expected to be more common. The pattern found in the survey material does not necessarily negate this proposed function but certainly does not provide supporting evidence. One possible explanation for the lack of ornaments at Chacoan structures is that these “goodies” were picked up by aboriginal or historic visitors over the past several hundred years.
Table 5.67. Ratios of chipped stone to groundstone, minerals, and ornaments at Anasazi grouped site types.
|
Table 5.68. Ratios of chipped stone to groundstone, minerals, and ornaments at small structures in all survey areas. |
||||||||
|---|---|---|---|---|---|---|---|---|
| Survey Area | ||||||||
| Kin Klizhin | Kin Bineola | Chacra Mesa | South Addition | |||||
| Artifact Type | No. | Ratio | No. | Ratio | No. | Ratio | No. | Ratio |
| Chipped
stone Groundstone Mineral Ornament |
371
18 2 - |
20.6 185.5 |
299
9 1 - |
33.2 299.0 |
718
38 19 2 |
18.9 37.8 359.0 |
175
13 10 - |
13.5 17.5 |
Discussion of Technological Variability
¶ 120 The preceding examination of the technology of lithic materials has investigated several temporal and spatial patterns apparent in the chipped stone and groundstone assemblages of the Additions Survey areas. This discussion summarizes the major contributions of this analysis.
¶ 121 This analysis, similar to others, has documented technological variability between cultural groupings. Archaic sites contain higher proportions of biface thinning flakes, formal tools, and bifacially worked tools than do Anasazi sites. A heavier reliance on bifacial reduction during the Archaic was suggested as a probable interpretation of this pattern. Other analyses in the San Juan Basin which used slightly different techniques to address the same question of technological variability between Archaic and Anasazi assemblages have also found a similar pattern (Simmons 1982). Greater reliance on mobility by Archaic populations has been used to account for these differences (Parry and Kelly 1987).
¶ 122 The problem of classifying the Other/Unknown sites into a cultural grouping was also addressed. Other/Unknown sites were usually large lithic scatters, often assigned to the grouped site type “camp,” from which few if any decorated ceramics were recorded. The majority of these undatable sites were located on Chacra Mesa and raw material types utilized at the sites are not distinctive from assemblages of other cultural affiliations (see the discussion under material selection). Tool assemblages from Other/Unknown sites were compared to Anasazi, Navajo, and Archaic assemblages, with the result that Other/Unknown assemblages were shown to be Anasazi, and possibly Navajo assemblages. Other/Unknown assemblages contained high percentages of utilized/retouched pieces and fewer bifacially worked tools than the Archaic assemblage. Thus, the majority of the Other/Unknown sites, specifically Archaic/Anasazi assemblages, were suggested to be part of the Anasazi settlement and subsistence system.
¶ 123 Temporal variation in chipped stone assemblages was also seen in the Anasazi sites. In general, the relative proportion of debitage and the frequency of hammerstones increases over time. These patterns suggest a possible increase in raw material reduction over time although this trend is not as evident when individual survey areas are examined.
¶ 124 Tool assemblages from small structures in the Kin Bineola area have relatively high proportions of both formal and informal tools, although the latter are dominant. Small structures also have relatively fewer pieces of groundstone per chipped stone artifact in comparison to small structures in other areas. In addition, the proportion of hammerstones tripled and the proportion of debitage doubled between the A.D. 890 to 1025 and 1030 to 1130 time periods for the Kin Bineola assemblage in general.
¶ 125 Chacoan structures differ from all other site types. Variation within individual survey areas was not examined in this section because sample sizes were inadequate. Over 80 percent of the tool assemblage from Chacoan structures was comprised of informal tools and cores. Consequently, this assemblage had a low diversity of tools when compared to other site types. An excavated sample from a Chacoan structure in Chaco Canyon (Pueblo Alto) also follows this same general pattern (Cameron 1987). Unfortunately, the function of utilized/retouched pieces is not known. Microwear analysis on excavated samples may provide some useful insights into the use of these tools. However, the lack of diversity in the tool assemblages from Chacoan structures does suggest that a limited range of activities involving formally shaped chipped stone were performed at these sites. Moreover, ornaments were not found in the surface remains of Chacoan structures but minerals were recorded at relatively higher frequencies at these large sites than at any other grouped site type.
Manufacture and Utilization of Nonlocal Raw Materials
¶ 126 This section attempts to bring together the patterns of raw material procurement and of lithic technology which have been discussed in previous portions of this chapter. Temporal and spatial variability in the manufacture and use of local and nonlocal raw materials are contrasted.
Total Assemblage
¶ 127 General comparison of the proportions of local and nonlocal materials used for various artifact types shows that nonlocal materials are more fully used than readily available local materials. Almost 6 percent of the nonlocal materials were used for formal tools, compared with only 2 percent of the local materials (Table 5.69). Similarly, almost 12 percent of the nonlocal material showed evidence of having been utilized or retouched compared with less than 5 percent of the local material.
|
Table 5.69. Distribution of all local and nonlocal materials by artifact type. |
||||||
|---|---|---|---|---|---|---|
| Nonlocal | Local | Total | ||||
| Artifact Type | No. | % | No. | % | No. | % |
| Formal tools | 95 | 5.55 | 373 | 1.56 | 468 | 1.83 |
| Utilized/retouched flakes | 202 | 11.81 | 1,109 | 4.66 | 1,311 | 5.14 |
| Debitagea | 1,393 | 81.41 | 20,677 | 86.86 | 22,070 | 86.49 |
| Other (groundstone, hammerstones, minerals, ornaments, other) | 21 | 1.23 | 1,646 | 6.91 | 1,667 | 6.53 |
| Total | 1,711 | 100.0 | 23,805 | 100.0 | 25,515 | |
| aIncludes cores. | ||||||
¶ 128 In general, debitage frequencies of local and nonlocal materials are similar (Table 5.70). However, a higher frequency of secondary flakes made on nonlocal raw materials (36.6 percent) was recorded, compared to local material (29.5 percent). Nonlocal materials may be of a higher quality, making flake attributes (i.e., bulbs and platforms) easier to discern. Consequently, artifacts of nonlocal material were more often classified as flakes.
|
Table 5.70. Percentage of nonlocal and local flakes in the total assemblage. |
||||
|---|---|---|---|---|
| Nonlocal | Local | |||
| Flake Type | No. | % | No. | % |
| Primary | 69 | 5.0 | 798 | 3.9 |
| Secondary | 500 | 36.6 | 5,996 | 29.5 |
| Angular Debris | 777 | 56.8 | 13,251 | 65.2 |
| Biface Thinning | 21 | 1.5 | 267 | 1.3 |
| TOTAL | 1,367 | 20,312 | ||
Anasazi and Archaic Utilization of Raw Materials
¶ 129 Anasazi and Archaic inhabitants of the survey areas utilized nonlocal raw material in slightly different manners. As described above, nonlocal materials are more frequent at Anasazi sites. Over 17 percent of the tools recorded at Anasazi sites were manufactured from nonlocal materials, while less than 7 percent of the total tool assemblage from Archaic sites were made of nonlocal materials (Table 5.71). Collecting of Archaic projectile points may, in part, account for the low proportion of tools made of nonlocal materials. The debitage to tool ratios from both Archaic and Anasazi sites shows that relatively fewer pieces of nonlocal debitage were recorded for both cultural affiliations. These figures suggest that raw materials which were brought into the area were either initially reduced to lighten the transport load or that the nonlocal debitage was more intensively utilized as informal tools.
|
Table 5.71. Nonlocal and local debitage and tools at Anasazi and Archaic sites. |
||||
|---|---|---|---|---|
| Anasazi | Archaic | |||
| Artifact Type | Nonlocal | Local | Nonlocal | Local |
| Debitage | 1,207 | 14,880 | 13 | 443 |
| Toola | 219 | 1,041 | 3 | 42 |
| Ratio | 5.5 | 14.3 | 4.3 | 10.5 |
| % Nonlocal Debitage | 7.5 | 2.8 | ||
| % Nonlocal Tools | 17.4 | 6.7 | ||
| aIncludes utilized and retouched flakes, projectile points, scrapers, bifaces, and drills. | ||||
Temporal Changes in Anasazi Reduction of Nonlocal Material
¶ 130 As was demonstrated earlier, the proportion of nonlocal materials increases slightly after A.D. 1030, and the debitage to tool ratio generally increases over time. These changes are again reflected in Table 5.72. The debitage to tool ratio of both nonlocal and local materials increases over time. The frequency of nonlocal debitage and tools increased between A.D. 890 to 1025 and A.D. 1030 to 1130.
Table 5.72. Nonlocal and local debitage and tools by time group at Anasazi sites.
Manufacture of Raw Materials at Chacoan Structures
¶ 131 The proportion of nonlocal materials and the technology of the chipped stone assemblages from Chacoan structures and great kivas was earlier shown to be slightly different from other grouped site types. Compared to the lithic assemblage from other site types and relative to the tools, a slightly higher proportion of debitage made on nonlocal materials was recovered from Chacoan structures and great kivas (Table 5.73). However, at all site types local debitage, both in total frequency and relative to each tool, was more common than debitage of nonlocal material. Consequently, the majority of tool manufacture occurred on locally available materials and specialized manufacture of tools made of nonlocal materials does not seem to be a plausible explanation for the high proportion of nonlocal debitage at Chacoan structures.
Table 5.73. Nonlocal and local debitage and tools at Anasazi grouped site types.
¶ 132 Table 5.74 lists the local and nonlocal tool types at Anasazi grouped site types. The percentages listed in the table are the proportion of tools for a specific tool type which were manufactured of nonlocal raw material at the individual site types. In general, nonlocal cores were not common at any of the grouped site types; and fairly high frequencies of nonlocal points were found at all grouped site types.
Table 5.74. Tools of nonlocal and local materials from Anasazi grouped site types.
Spatial Variation in Raw Material Utilization
¶ 133 As discussed above, the frequency of nonlocal materials at large structures in the four survey areas varies substantially over time but frequently exceeds the percentages of nonlocal materials recorded at small houses (large structures) within Chaco Canyon. The manner in which nonlocal materials were utilized in the survey areas is also variable. The Kin Bineola survey area contains the highest proportions of nonlocal debitage and tools. However, these frequencies are still modest (20 percent of the tool and 15 percent of the debitage assemblages) (Table 5.75). The Chacra Mesa and South Addition survey areas, which are part of Chaco Canyon, contain the lowest percentages of nonlocal debitage. Moreover, relatively few pieces of nonlocal debitage were found for each tool recorded. Given the close proximity of the Chaco Canyon Chacoan structures such as Pueblo Bonito and Chetro Ketl to these survey areas, utilization of Chacra Mesa and the South Addition areas may have emphasized seasonal procurement activities such as farming or gathering. This difference in land usage is also reflected in the frequencies of nonlocal materials at grouped site types. For example, lower percentages of nonlocal materials were recorded from nonstructural site types and small structure site types (Table 5.73)—sites that may have been used seasonally for farming or wild resource procurement activities.
|
Table 5.75. Nonlocal and local debitage and tools at Anasazi sites in the survey areas. |
||||||||
|---|---|---|---|---|---|---|---|---|
| Survey Area | ||||||||
| Kin Klizhin | Kin Bineola | Chacra Mesa | South Addition | |||||
| Artifact Type | Nonlocal | Local | Nonlocal | Local | Nonlocal | Local | Nonlocal | Local |
| Debitage | 197 | 3,020 | 473 | 2,611 | 203 | 4,114 | 40 | 850 |
| Toola | 20 | 193 | 64 | 251 | 63 | 359 | 14 | 68 |
| Ratio | 9.9 | 15.6 | 7.4 | 10.4 | 3.2 | 11.5 | 2.9 | 12.5 |
| % Nonlocal Debitage | 6.1 | 15.3 | 4.7 | 4.5 | ||||
| % Nonlocal Tools | 9.4 | 20.3 | 14.9 | 17.1 | ||||
| Note: Table does not include
debitage or tools from proveniences with occupation spans of 200
years or more. aIncludes utilized and retouched flakes, projectile points, scrapers, bifaces, and drills. |
||||||||
Summary of Temporal and Spatial Variation
¶ 134 Temporal and spatial variation in the manufacture and use of nonlocal raw material has been described in this section. In general, nonlocal materials appear to have been utilized more intensively than locally available materials. This difference in use may, in part, be accounted for by the fact that nonlocal materials such as Narbona Pass chert and obsidian are higher quality materials compared to locally available ones.
¶ 135 Nonlocal materials comprise a larger portion of the Anasazi chipped stone assemblage (both debitage and tools) when compared to Archaic assemblages. However, relative to the tools, nonlocal debitage is not common at either Anasazi or Archaic sites. Nonlocal artifacts from both the Archaic and Anasazi appear to have undergone at least initial reduction in locations outside the survey areas. The purpose of this reduction may have been to lighten the carrying load. If populations utilized a mobile settlement pattern, as was probably the case during the Archaic, then weight of transported items may have been an important variable. During the Anasazi period, the weight of goods which were transported over distances greater than 50 km may have also been critical if chipped stone material was acquired while procuring other items such as architectural beams or ceramic containers. In other words, if acquisition of chipped stone materials was embedded in other procurement strategies, the weight and size of lithic materials was probably consciously minimized.
¶ 136 The utilization of nonlocal materials changes slightly during the course of the Anasazi period. Debitage on nonlocal material increases in frequency and in relative proportion to the tools over time. The frequency of nonlocal tools shows no clear temporal increase.
¶ 137 Chacoan structures and sites in the Kin Bineola survey area have been shown to have high frequencies of nonlocal debitage. However, in both cases debitage made on locally available materials still makes up over 80 percent of the assemblage. Consequently, although this variability is intriguing and requires further investigation, markers of complex social organization such as restricted access and redistribution of resources are probably not necessary to account for this relatively small proportion of exotic materials.
Conclusions
¶ 138 Spatial and temporal variability in raw material types and artifact frequencies have been used to examine strategies of chipped stone procurement, especially the procurement of nonlocal materials, and patterns of chipped stone manufacture and use. These patterns are summarized here through comparisons among cultural groups, between the two Chacoan outliers (Kin Bineola and Kin Klizhin) and their surrounding communities, comparisons among the four survey areas, and comparisons of the survey areas to sites in Chaco Canyon and elsewhere in the region.
Comparisons Between Cultural Groups
¶ 139 Material types were generally similar among cultural groups, indicating expedient use of locally available materials during all cultural periods. Similar debitage/tool ratios for nonlocal materials at Anasazi and Archaic sites also suggests comparable methods of procuring nonlocal material by these two cultural groups. However, some technological differences were apparent among cultural groups. Debitage and tool assemblages at Archaic sites contain higher proportions of biface thinning flakes and formal tools, particularly bifacially worked tools, than those of other cultural periods. Bifacial reduction seems to have been more common at Archaic sites, while assemblages at Anasazi and Navajo sites suggested an emphasis on flake production and the use of expediently produced tools such as utilized and retouched flakes.
¶ 140 Chipped stone technology at sites of indeterminate cultural affiliation (Other/Unknown) resembled that at Anasazi sites. Most of these sites consisted of lithic scatters or camp sites located on Chacra Mesa. Other/Unknown sites, like Anasazi sites, contained higher proportions of utilized and retouched flakes and fewer projectile points than Navajo and Archaic sites. Again, an emphasis on expediently produced tools is suggested.
Comparisons Between Outliers and Outlier Communities
¶ 141 The two outlying Chaco structures of Kin Bineola and Kin Klizhin show similar frequencies (16 percent) of nonlocal materials although the most prevalent nonlocal material at each site is different. At Kin Bineola (29SJ 1580), yellow-brown spotted chert is the most common nonlocal material (7 percent), while at Kin Klizhin (29SJ 1413), the most common nonlocal material is Narbona Pass chert (12 percent).
¶ 142 Habitation sites (large structural sites) in the communities surrounding these Chacoan structures during the time groups when the structures were inhabited (A.D. 890 to 1025 and 1030 to 1130 for Kin Bineola and A.D. 1030 to 1130 for Kin Klizhin), show similar patterns (Table 5.23). Relative frequencies of nonlocal materials at large structures in both areas are similar (10-19 percent): yellow-brown spotted chert is most common at sites in the Kin Bineola area and Narbona Pass chert is most common at sites in the Kin Klizhin area. Although the frequency of nonlocal material at large structures is relatively high in both areas during the periods when the Chacoan structures are occupied, it is higher or nearly as high in the preceding and subsequent periods when the Chacoan structures had either not been built, or were no longer in use. In sum, there appears to be little difference between the Chacoan structure and the surrounding community in access to nonlocal material in either area. As emphasized earlier, this pattern of unrestricted access may indicate that if periodic events held at Chacoan structures they were attended primarily by community members. However, the presence of comparable quantities of nonlocal materials in periods before and after use of the Chacoan structures raises the possibility these structures had a limited role in the distribution of nonlocal lithic materials in the survey areas.
¶ 143 This point is further stressed by the examination of the effect of the proximity of a Chacoan structure or great kiva on the frequency of nonlocal material at habitation sites. A comparison of the frequency of nonlocal material at sites ranked by distance to the nearest Chacoan structure or great kiva showed no clear directional patterning in either the Kin Klizhin and Kin Bineola survey areas.
Comparisons Among the Four Survey Areas
¶ 144 Differences in material selection among survey areas during the Anasazi period were apparent for both local and nonlocal material. Variation in the relative proportions of local material among survey areas may reflect the availability of chipped stone material within each area. Chalcedonic silicified wood was most prevalent on Chacra Mesa and at the South Addition during most time periods. At Kin Bineola, high surface chert and chalcedonic silicified wood were the most frequent materials during most time periods. At Kin Klizhin, splintery silicified wood and miscellaneous chert/chalcedony were common. Although known sources for local materials are generally north of the Chaco Canyon area (while two of the survey areas—Kin Klizhin and Kin Bineola—are west of Chaco Canyon), local materials may occur differentially in redeposited gravels in any of these areas, producing variability in the types and quantities of material that are available. Geological studies of the composition of these gravel deposits are necessary before immediately available resources within each survey area can be identified.
¶ 145 The frequency of nonlocal material was higher at Chaco structures and great kivas in the two outlier survey areas (16 percent) than in the Chacra Mesa survey area (8 percent) (The South Addition had no Chaco structure or great kiva). While this suggests that the outlier sites influenced the distribution of nonlocal material, the sample from Chacoan structure in the Kin Klizhin area is represented by less than 100 items.
¶ 146 There are differences in the types of nonlocal materials present in the four survey areas. Yellow-brown spotted chert is the most common local type in the Kin Bineola survey area during all time groups (4 percent to 14 percent), although during the intervals from A.D. 890 to 1025 and A.D. 1030 to 1130 (when the Kin Bineola Chacoan structure was inhabited), the frequency of Narbona Pass chert also increases (from 3 percent to 5 percent). At Kin Klizhin, nonlocal materials are infrequent until the A.D. 1030 to 1130 and A.D. 1130 to 1230 time periods. During the latter period Narbona Pass chert is the most common type (5 percent). In comparison, Narbona Pass chert is the most common nonlocal material at sites in Chaco Canyon during the period from A.D. 1020 to 1120 (greater than 25 percent of the assemblage at some sites). While the quantities of Narbona Pass chert at Kin Klizhin and Kin Bineola are much lower, they do suggest increased use of and access to this material either through direct access to the source or through interactions with residents of Chaco Canyon.
¶ 147 At Chacra Mesa, nonlocal materials are infrequent (less than 5 percent of the assemblage) in the A.D. 890-1025 and 1030-1130 time periods, but range from 6-10 percent in the remaining periods. Obsidian is the most common (4 to 6 percent) nonlocal material in the two earliest time periods. Nonlocal materials are found very infrequently at sites in the South Addition, except for the period from A.D. 1030 to 1130, when Narbona Pass chert is the most common type (4 percent).
¶ 148 Technological and functional variability among survey areas is generally minimal, and observed differences tended to be between Kin Bineola and the other three areas. During the Anasazi period, the debitage/tool ratio for nonlocal material was slightly higher at Kin Bineola and Kin Klizhin than at the other two survey areas, suggesting a difference between outlier and non-outlier sites in methods of procuring nonlocal material. In the Kin Bineola area, tool assemblages from small structures have a higher frequency of utilized and retouched pieces and fewer pieces of ground stone than small structures in the other survey areas. While there is little technological variability over time in other areas, at Kin Bineola between A.D. 890 to 1025 and A.D. 1030 to 1130, the frequency of utilized and retouched pieces decreases while the debitage to tool ratio increases. These patterns may indicate functional differences at sites in the Kin Bineola area which are not apparent at sites in the other survey areas.
Regional Comparisons
¶ 149 Interestingly, the frequencies of nonlocal materials at large structures in the survey areas are often higher than the percentages of nonlocal materials at small houses in Chaco, particularly during the A.D. 1030-1130 and 1130-1230 time periods. This is also true of all five time periods at Kin Bineola where yellow-brown spotted chert was the most common nonlocal material. Although Chacoan structures at Kin Bineola and Kin Klizhin had relatively high frequencies of nonlocal materials (15 to 20 percent), they did not have frequencies as high as those at sites in Chaco Canyon (30 to 50 percent).
¶ 150 Of the nonlocal material identified in the survey areas, only Narbona Pass chert can be confidently tied to a spatially restricted source area. As noted above, this material has been found in very high frequencies at Chacoan structures in Chaco Canyon after A.D. 1020; frequencies far higher than would be expected through a normal fall-off with distance to source (Cameron 1984). Chacoan structures in the survey areas do not show these very high frequencies of Narbona Pass chert, but they do exhibit frequencies that are greater than suggested by normal fall-off with distance to source. Chipped stone may have been procured through contact with residents of Chaco Canyon perhaps through some sort of redistribution, or residents of the Kin Klizhin and Kin Bineola Chacoan structures may have accessed the Narbona Pass chert source directly.
Lithic Procurement and Technology in the Survey Areas
¶ 151 In summary, technological variability is most apparent in the comparison of reduction strategies used by Archaic and Anasazi populations, with Archaic groups placing more emphasis on the production of bifacial tools. Similar to other areas of the Southwest and North America, this shift toward greater reliance on expedient reduction strategies reflects increased sedentism during the Anasazi time periods. Although Anasazi sites in the survey areas were characterized by expedient reduction strategies, comparisons of the tool assemblages showed some interesting variability. In particular, Chacoan structures contained fewer formal tools, a finding which is associated with a low diversity of tool types. The dominance of informal tools has also been found in well excavated assemblages at Chacoan structures within Chaco Canyon (Cameron 1987). If one of the important functions of Chacoan structures was as gathering places for large but temporary populations, expedient tools such as utilized flakes and informally retouched pieces probably produced adequate cutting and scraping edges for the activities that occurred in these contexts.
¶ 152 In regard to raw material use, the inhabitants of the sites in the survey areas obtained chipped stone materials primarily by procuring the most readily available local materials. This is true even at Chacoan structures and great kivas. Nonlocal materials seem to have been obtained from several different sources, with some variability over time and space in the types of materials obtained. Nonlocal materials were more commonly used during the period when the Chacoan Regional system was at its peak (A.D. 1030 to 1130), but increased access to these raw materials does not mean that a single type of exchange was responsible for this greater availability. Chipped stone materials were likely acquired during the course of numerous economic activities and through direct procurement as well as various types of exchange relations.
¶ 153 Recently, Bayman (1995) has argued that normative (and outdated) models of redistribution are inadequate for explaining the distribution of nonlocal lithic raw materials at archeological sites in the American Southwest. In the Hohokam area, he proposes that various types of exchanges and interactions, including ritual gatherings and “an admixture of redistribution and reciprocity” (Bayman 1995:56), were responsible for bringing obsidian to platform mound communities within the Tucson Basin. The exchange relations that brought nonlocal lithic raw materials and other goods to Chaco Canyon and its outliers were probably equally variable and reflect the intricate connections between large structures and Chacoan structures that were an integral part of life in the San Juan Basin during the A.D. eleventh and twelfth centuries.
Notes
1 The term Chacoan structure is used throughout this chapter in place of great house.
References
| Bayman, James M. | |||
| 1995 | Rethinking “Redistribution” in the Archaeological Record”: Obsidian Exchange at the Marana Platform Mound. Journal of Anthropological Research 51:37-63. | ||
| Binford, Lewis R. | |||
| 1979 | Organization and Formation Processes: Looking at Curated Technologies. Journal of Anthropological Research 35(3):255-273. | ||
| Cameron, Catherine M. | |||
| 1984 | A Regional View of Chipped Stone Raw Material Use in Chaco Canyon. In Recent Research on Chaco Prehistory, edited by W. James Judge and John D. Schelberg, pp. 137-152. Reports of the Chaco Center, Number 8. Division of Cultural Research, National Park Service, Albuquerque. | ||
| ---- | |||
| 1987 | Chipped Stone from Pueblo Alto. In Investigations at the Pueblo Alto Complex, Chaco Canyon New Mexico, 1975-1979. Volume III, Part I, Artifactual and Biological Analyses, edited by Frances Joan Mathien and Thomas C. Windes, pp. 231-278. Publications in Archeology 18F, Chaco Canyon Studies. National Park Service, Santa Fe. | ||
| ---- | |||
| 1997 | The Chipped Stone of Chaco Canyon, New Mexico. In Ceramics, Lithics, and Ornaments of Chaco Canyon. Analyses of Artifacts from the Chaco Project, 1971-1978. Volume II. Lithics, edited by Frances Joan Mathien, pp. 531-609. Publications in Archeology 18G. Chaco Canyon Studies. National Park Service, Santa Fe. | ||
| Cameron, Catherine M. And Robert Lee Sappington | |||
| 1984 | Obsidian Procurement at Chaco Canyon, A.D. 500-1200. In Recent Research on Chaco Prehistory, edited by W. James Judge and John D. Schelberg, pp. 153-171. Reports of the Chaco Center, Number 8. Division of Cultural Research. National Park Service, Albuquerque. | ||
| Chapman, Richard C. | |||
| 1977 | Analysis of the Lithic Assemblages. In Settlement and Subsistence along the Lower Chaco River: the CGP Survey, edited by Charles A. Reher, pp. 371-452. University of New Mexico Press, Albuquerque. | ||
| Ford, Dabney | |||
| 1982 | Bis sa'ani Ceramics. In Bis sa'ani: A Late Bonito Phase Community on Escavada Wash, Northwest New Mexico, Volume 2, Part 1, edited by Cory Dale Breternitz, David E. Doyel, and Michael P. Marshall, pp. 359-414. Navajo Nation Papers in Anthropology No. 14. Navajo Nation Cultural Resources Management Program, Window Rock. | ||
| Hayes, Alden C. | |||
| 1981 | A Survey of Chaco Canyon Archeology. In Archeological Surveys of Chaco Canyon, New Mexico, by Alden C. Hayes, David M. Brugge, and W. James Judge, pp. 1-68. Publications in Archeology 18A, Chaco Canyon Studies. National Park Service, Washington, D.C. | ||
| Jacobson, Louann | |||
| 1984 | Chipped Stone in the San Juan Basin: A Distributional Analysis. Unpublished M.A. thesis, Department of Anthropology, University of New Mexico, Albuquerque. | ||
| Judge, W. James | |||
| 1979 | The Development of a Complex Cultural Ecosystem in the Chaco Basin, New Mexico. In Proceedings of the First Conference on Scientific Research in the National Parks, Volume 2, edited by Robert M. Linn, pp. 901-906. National Park Service Transactions and Proceedings Series 5. Washington, D.C. | ||
| ---- | |||
| 1989 | Chaco Canyon—San Juan Basin. In Dynamics of Southwestern Prehistory, edited by Linda J. Cordell and George J. Gumerman, pp. 209-261. Smithsonian Institution Press, Washington, D.C. | ||
| Kilby, J. David | |||
| 2005 | A Survey of Lithic Raw Material Sources in and Around El Malpais National Monument. In The El Malpais Archaeological Survey, Phase I, edited by Robert P. Powers and Janet D. Orcutt, pp. 233-250, Intermountain Cultural Resources Management Professional Paper No. 70, Santa Fe, NM. | ||
| Kelly, Robert Lavrens | |||
| 1985 | Hunter-gatherer Mobility and Sedentism: A Great Basin Study. Unpublished Ph.D. dissertation, University of Michigan, Ann Arbor. | ||
| Kintigh, Keith | |||
| 1984 | Measuring Archaeological Diversity by Comparison with Simulated Models. American Antiquity 49:44-54. | ||
| LeTourneau, Philippe D. | |||
| 1997 | Sources and Prehistoric Use of Yellow-Brown Spotted Chert in Northwest-Central New Mexico. Paper presented to the 62nd Annual Meeting of the Society for American Archaeology, Nashville. | ||
| Lekson, Stephen H. | |||
| 1984 | Great Pueblo Architecture of Chaco Canyon, New Mexico. Publications in Archeology 18B, Chaco Canyon Studies, Albuquerque. | ||
| Loose, Richard W., and Thomas R. Lyons | |||
| 1976 | The Chetro Ketl Field: A Planned Water Control System in Chaco Canyon. In Remote Sensing Experiments in Cultural Resource Studies, assembled by Thomas R. Lyons, pp. 133-156. Reports of the Chaco Center, Number 1. National Park Service and University of New Mexico, Albuquerque. | ||
| Love, David W. | |||
| 1997 | Appendix 3A: Petrographic Description and Sources of Chipped Stone Artifacts in Chaco Canyon. In Ceramics, Lithics, and Ornaments of Chaco Canyon. Analyses of Artifacts from the Chaco Project, 1971-1978. Volume II. Lithics, edited by Frances Joan Mathien, pp. 610-633. Publications in Archeology 18G, Chaco Canyon Studies. National Park Service, Santa Fe. | ||
| Mathien, Frances Joan | |||
| 1997 | Ornaments of the Chaco Anasazi. In Ceramics, Lithics, and Ornaments of Chaco Canyon. Analyses of Artifacts from the Chaco Project, 1971-1978. Volume III. Lithics and Ornaments, edited by Frances Joan Mathien, pp. 1119-1219. Publications in Archeology 18G. National Park Service, Santa Fe. | ||
| Moore, Roger A. | |||
| 1983 | Patterns in Synchronic and Diachronic Variation in the Prehistoric Lithic Assemblages. In Cultural Resource Investigation on Gallegos Mesa: Excavations in Blocks VIII and IX, and Testing Operations in Blocks X and XI, Navajo Indian Irrigation Project, San Juan County, New Mexico, Volume 2, by Lawrence E. Vogler, Dennis Gilpin, and Joseph K. Anderson, pp. 549-691. Navajo Nation Papers in Anthropology Number 24. Navajo Nation Cultural Resource Management Program, Window Rock, Arizona. | ||
| Parry, William J. and Robert L. Kelly | |||
| 1987 | Expedient Core Technology and Sedentism. In The Organization of Core Technology, edited by Jay K. Johnson and Carol A. Morrow, pp. 285-304. Westview Press, Boulder, Colorado. | ||
| Powers, Robert P., William B. Gillespie, and Stephen H. Lekson | |||
| 1983 | The Outlier Survey: A Regional View of Settlement in the San Juan Basin. Reports of the Chaco Center, Number 3. Division of Cultural Research, National Park Service, Albuquerque. | ||
| Reid, J. Jefferson | |||
| 1982 | Analytic Procedures for Interassemblage-Settlement System Analysis. In Cholla Project Archaeology, Volume 1. Introduction and Special Studies, edited by J. Jefferson Reid, pp193-204. Archaeological Series 161, Arizona State Museum, University of Arizona, Tucson. | ||
| Simmons, Alan | |||
| 1982 | Technological and Typological Variability of Lithic Assemblages in the Bis sa'ani Community. In Bis sa'ani: A Late Bonito Phase Community on Escavada Wash, Northwest New Mexico, Volume 3, edited by Cory Dale Breternitz, David E. Doyel, and Michael P. Marshall, pp. 955-1013. Navajo Nation Papers in Anthropology No. 14. Navajo Nation Cultural Resource Management Program, Window Rock, Arizona. | ||
| Smiley, F. E. | |||
| 1982 | Black Mesa Archaeological Program 1982 Field Lithic Analysis System. Unpublished ms. in possession of the author. | ||
| Sullivan, Alan P., III, and Kenneth C. Rozen | |||
| 1985 | Debitage Analysis and Archeological Interpretation. American Antiquity 50:755-779. | ||
| Toll, H. Wolcott | |||
| 1984 | Trends in Ceramic Import and Distribution in Chaco Canyon. In Recent Research on Chaco Prehistory, edited by W. James Judge and John D. Schelberg, pp. 115-135. Reports of the Chaco Center, Number 8. Division of Cultural Research, National Park Service, Albuquerque. | ||
| Vivian, R. Gwinn | |||
| 1960 | The Navajo Archaeology of the Chacra Mesa, New Mexico. Unpublished M.A. thesis, Department of Anthropology, University of New Mexico, Albuquerque. | ||
| ---- | |||
| 1970 | An Inquiry into Prehistoric Social Organization in Chaco Canyon, New Mexico. In Reconstructing Prehistoric Pueblo Societies, edited by William A. Longacre, pp. 59-83. A School of American Research Book, University of New Mexico Press, Albuquerque. | ||
| Warren, A. Helene | |||
| n.d. | Lithic Code. Unpublished ms. and material samples, H.P. Mera Collection of the Laboratory of Anthropology. Housed at the Center for New Mexico Archaeology, Santa Fe. | ||
| Whitmore, Jane | |||
| 1979 | An Archeological Survey near Prewitt, New Mexico. Contract Archaeology Report No. 74. Unpublished report on file, Library, School for Advanced Research, Santa Fe. | ||
| Whittlesey, Stephanie M. | |||
| 1982 | Summary of Cholla Project Chipped Stone Studies. In Cholla Project Archaeology, Volume 1. Introduction and Special Studies, edited by J. Jefferson Reid, pp. 51-61. Archeological Series 161, Arizona State Museum, University of Arizona, Tucson. | ||
| Windes, Thomas C. | |||
| 1987 | Conclusions. In Investigations at the Pueblo Alto Complex, Chaco Canyon, New Mexico, 1975-1979. Volume I. Summary of Tests and Excavations at the Pueblo Alto Complex, by Thomas C. Windes, pp. 411-425. Publications in Archeology 18F. National Park Service, Santa Fe. | ||
| Zar, J. H. | |||
| 1974 | Biostatistical Analysis. Prentice Hall, Englewood Cliffs, NJ. | ||
Appendices
Appendix 5.1: Chaco Additions Survey Lithic Database
Appendix 5.1 is a printout of the Chaco Additions Survey lithic database, organized by survey area and site number. Because of its size the printout has been divided into two pdf files. Part 1, (http://www.chacoarchive.org/media/pdf/006535_Part1.pdf) includes the Kin Klizhin, Kin Bineola, and part of the Chacra Mesa data (to site 29 SJ 2584) while Part 2 (http://www.chacoarchive.org/media/pdf/006535_Part2.pdf) includes the remainder of the Chacra Mesa data (continuing with 29 SJ 2584) and all of the South Addition lithic data.
Appendix 5.2: Description of Raw Materials and Discussion of Identification.
Lisa Wills and Lisa C. Young
¶ 154 Classification and numeric coding of raw materials are based on Love (1997) and Warren (n.d.) respectively. The two works have been abbreviated for the purposes of this analysis.
Cherts
General
¶ 155 The general chert category was used for raw materials which were opaque and were not classified into the more specific chert categories below.
Laguna (1430)
¶ 156 May be either a chert or chalcedony.
| Texture: | Fibrous cryptocrystalline, vugs and microquartz crystals. |
| Color: | Chalcedonic variety is colorless to moderate reddish brown with greenish mottling. Chert variety is reddish brown to orangish brown with greenish mottling. |
| Luster: | Chalcedonic has dull to waxy luster. Chert has dull luster. |
| Transparency: | Chalcedonic variety has transparent edges. Cherty variety has opaque edges. |
| Fracture: | Conchoidal fracture with rough surface when quartz crystals present. |
| Cortex: | Unknown. |
| Source: | Nonlocal. |
High Surface (1050-1054)
¶ 157 The chert and chalcedonic varieties of this material were separated on the form. However, a single piece could contain both varieties in the same piece.
| Texture: | Cryptocrystalline, fibrous or spherulitic with microcrystaline quartz vugs. |
| Color: | 1050 is white. |
| 1051 is white with black mossy inclusions. | |
| 1052 is clear to transparent. | |
| 1053 is clear with black mossy or veiny inclusions. | |
| 1054 is clear with black, white and/or red inclusions. | |
| Luster: | Dull to waxy luster, waxy more common with the chalcedonic varieties (1052-1054). |
| Transparency: | 1050 and 1051 are opaque. 1052, 1053, and 1054 are transparent. |
| Fracture: | Conchoidal ranging from good fracture properties to very poor. |
| Cortex: | Rounded cobble and/or patina. |
| Source: | Local. |
Black Chert (1030-1031)
| Texture: | Cryptocrystalline. |
| Color: | Black, occasionally with dark gray. |
| Luster: | Waxy. |
| Transparency: | Opaque. |
| Fracture: | Usually good conchoidal. |
| Cortex: | Cobble, river rolled, often pitted. |
| Source: | Local. |
Fossiliferous (1010)
| Texture: | Cryptocrystalline with small quartz crystal and fossil inclusions. |
| Color: | Wide variety (not distinguishing characteristic)—grays, light browns, reds, banding possible. |
| Luster: | Dull waxy or creamy. |
| Transparency: | Opaque. |
| Fracture: | Good conchoidal, possibly brittle. |
| Cortex: | Cobble, smoothed or pitted. |
| Source: | Probably local. |
Red (1060) and Yellow (1070) Cherts
| Texture: | Dense cryptocrystalline with thin veins and vugs often filled with quartz. |
| Color: | 1060 is deep red. |
| 1070 is yellow often variegated with grays. | |
| Luster: | Dull. |
| Transparency: | Opaque. |
| Fracture: | Conchoidal, ranging from poor to good fracture properties. |
| Cortex: | Cobble. |
| Source: | Probably local. |
Morrison (1020-1022)
| Texture: | Wide variety, grades from fine grained granular chert to orthoquartzic and silicified siltstone. |
| Color: | Varieties of tan to dull reddish. |
| Luster: | Waxy, vitreous to dull. |
| Transparency: | Opaque. |
| Fracture: | Conchoidal to block. |
| Cortex: | Blocky cortex. |
| Source: | Nonlocal to local. |
Brushy Basin (1040-1041)
¶ 158 A member of the Morrison Formation.
| Texture: | Wide variety of grain sizes from pure cryptocrystalline to silicified conglomerate to unsilicified sandstone. |
| Color: | Greenish colors very distinctive, grades to yellow gray and dull pinks. |
| Luster: | Dull waxy to slightly shiny like unglazed porcelain. |
| Transparency: | Opaque. |
| Fracture: | Conchoidal fracture. |
| Cortex: | Blocky. |
| Source: | Nonlocal. |
Yellow-Brown Spotted (1072)
| Texture: | Cryptocrystalline, some with small quartz vugs. |
| Color: | Yellow-brown with black inclusions, changes to red color when heat-treated. |
| Luster: | Dull. |
| Transparency: | Opaque. |
| Fracture: | Conchoidal, some varieties blocky. |
| Cortex: | Variably, commonly rough. |
| Source: | Nonlocal. |
Narbona Pass (1080) (formerly known as Washington Pass)
| Texture: | Cryptocrystalline, fibrous grains with some opalescent cavities. |
| Color: | Wide variety from whitish gray to orangish pink to maroon, often banded. |
| Luster: | Waxy, very distinctive because naturally heat-treated. |
| Transparency: | Range from opaque to translucent. |
| Fracture: | Good concoidal fracture, but raw material often frost cracked. |
| Cortex: | Whitish patina. |
| Source: | Nonlocal. |
Pedernal (1090-1091)
| Texture: | Cryptocrystalline. |
| Color: | White with mossy reddish or yellow brown inclusions. |
| Luster: | Dull, waxy. |
| Transparency: | Chert variety opaque, chalcedonic variety transparent. |
| Fracture: | Good conchoidal fracture. |
| Cortex: | Variable, rough. |
| Source: | Nonlocal. |
Chalcedony
General
¶ 159 Like the general chert category, this category was used when the characteristics for the material do not fit into any of the more specific categories presented below provided that the majority of the material is transparent.
High Surface Chalcedony (1052-1054)
¶ 160 See above High Surface Chert.
Petrified Wood
¶ 161 All materials have visible woody structure.
Splintery Silicified (1109-1110)
¶ 162 aka. Crud Wood
| Texture: | Cryptocrystalline, poorly silicified with quartz inclusions. |
| Color: | 1109 includes light grays, whites, and tans. |
| 1110 has darker colors, browns, and blacks. | |
| Luster: | Dull. |
| Transparency: | Opaque. |
| Fracture: | Very poor conchoidal, breaks in splinters or slabs. |
| Cortex: | Variable with woody structure visible. |
| Source: | Local. |
Cherty Silicified (1112-1113)
| Texture: | Cryptocrystalline. |
| Color: | 1112 is dark colored, mostly browns. |
| 1113 is light colored, with grays and tans. | |
| Luster: | Shiny, can be waxy. |
| Transparency: | Opaque. |
| Fracture: | Conchoidal, often very good. |
| Cortex: | Smooth, often showing visible signs of woody structure. |
| Source: | Local. |
Chalcedonic Silicified Wood (1140, 1142, 1145)
| Texture: | Noncrystalline to cryptocrystalline, quartz crystal inclusions. |
| Color: | 1040 is white to light gray. |
| 1142 is variegated, white with light yellow, browns, and reds. | |
| 1145 has dark colors. | |
| Luster: | Dull waxy. |
| Transparency: | Opaque. |
| Fracture: | Conchoidal, often splintery. |
| Cortex: | Visible grains, often patinated. |
| Source: | Local. |
Red Wood (1120)
| Texture: | Cryptocrystalline. |
| Color: | Reds and reddish browns. |
| Luster: | Dull waxy to shiny. |
| Transparency: | Opaque. |
| Fracture: | Conchoidal. |
| Cortex: | Visible grains, variable. |
| Source: | Local. |
Palm Wood (1130)
¶ 163 Distinctive because of vascular rays of woody structure that form a fairly regular pattern.
| Texture: | Cryptocrystalline. |
| Color: | Variable, mostly browns. |
| Luster: | Waxy to dull. |
| Transparency: | Opaque. |
| Fracture: | Conchoidal. |
| Cortex: | Smooth, polished pebble. |
| Source: | Probably local. |
Yellow Wood (1150)
| Texture: | Cryptocrystalline with quartz crystal inclusions. |
| Color: | Mostly yellow with little white. |
| Luster: | Waxy to shiny. |
| Transparency: | Often mixture of opaque and translucent. |
| Fracture: | Conchoidal, often splintery. |
| Cortex: | Visible woody structure. |
| Source: | Local. |
Zuni Wood (1160)
| Texture: | Cryptocrystalline to fibrous. |
| Color: | Pastels—yellow, blues with red blotches. |
| Luster: | Waxy to shiny. |
| Transparency: | Opaque. |
| Fracture: | Conchoidal. |
| Cortex: | None seen. |
| Source: | Nonlocal. |
Quartzite (4000-4005)
| Texture: | Cryptocrystalline. |
| Color: | Wide variety, mostly darker colors. |
| Luster: | Dull. |
| Transparency: | Opaque. |
| Fracture: | Conchoidal. |
| Cortex: | Pebble. |
| Source: | Possibly local. |
Quartzitic Sandstone (2220-2221)
¶ 164 Similar to quartzite, but sand grains are visible on fracture surface.
Nacimiento (2202)
| Texture: | Cryptocrystalline. |
| Color: | Tans or browns with lighter streaks. |
| Luster: | Dull. |
| Transparency: | Opaque. |
| Fracture: | Conchoidal. |
| Cortex: | Unknown. |
| Source: | Nonlocal. |
Obsidian (3500's)
¶ 165 Volcanic glass from a wide variety of sources which could not be accurately identified in the field. See Cameron and Sappintgon (1984) for further discussion of sources.
Notes on Raw Material Classification
¶ 166 Material types were discussed by analysts, using the available Chaco Center type collection prior to going into the field and after the work day when needed. However, given the field situation in which crews were widely spaced over the landscape, some problems in consistency of classification between crews was unavoidable. Several local categories were probably not consistently recorded from crew to crew or even by the same person over a field season. Examples of specific problems in local raw material classification are given below. However, as is shown in the analysis, much of the patterning of raw material procurement involves the contrast between the nonlocal materials and local materials. Therefore, the problems involved in the classification of local materials do not greatly affect the interpretations presented in the chapter. All of the lithic analysts agreed that the nonlocal materials were distinctive and easily recognized. Consequently, the classification of nonlocal lithic materials was more consistently applied throughout the course of the survey.
¶ 167 As discussed above, several problems in classifying local raw material types were encountered. One basic criterion used to distinguish material types was color. Consequently, a piece of 1051 which did not contain black inclusions would be classified as 1050. Furthermore, the distinction between chert and chalcedony was also often difficult; and in many instances both varieties (cherty and chalcedonic) occurred on the same artifact. Another similar classificatory problem was encountered in distinguishing white chalcedony (1040) and white chalcedonic wood (1140). In some cases, wood grains were the primary criteria used to identify this raw material type. In other cases, especially after eight hours in the hot sun, wood grains were difficult to see. Consequently, between lithic analysts and within the same lithic analyst, whose familiarity with the materials increased as the season progressed, the classification of some raw material types, especially local types, varied.
Appendix 5.3: Description of Flake Types and Analysis Notes.
¶ 168 The system of flake classification used for in-field analysis during the inventory survey is based on the lithic recording system utilized by the Black Mesa Archaeological Program (Smiley 1982).
¶ 169 Primary Flake: from the initial stage of reduction
- simple platform which exhibits no signs of preparation, may have cortex
- dorsal face is covered by over 33 percent cortex and has no more than one flake scar
- flakes are characteristically thick and usually over 3-4 cm. in length
¶ 170 Secondary Flake: next stage of reduction after removal of primary flakes. After completing this stage of reduction a blank is formed.
- usually simple platform but may show signs of some preparation and may have cortex
- dorsal surface is covered by less than 33 percent cortex, may have no cortex, and has two or more flake scars
- flakes are usually thinner compared to primary flakes
¶ 171 Biface Thinning Flake: results from thinning of a biface
- small faceted platform, sometimes lipped and plane of the dorsal surface and the platform form an acute angle
- may have small amount of cortex on the dorsal surface. Flake scars on the dorsal surface tend to come together at a point near the distal end (i.e., the flake scars on the dorsal surface look like those on a biface)
- flake is curved in cross-section and feathers out from the platform with almost parallel sides
¶ 172 Angular Debris: anything that does not exhibit flake characteristics such as a bulb and platform
- shatter, distal end of flakes, or potlid
Notes on the Kin Klizhin Lithic Recording System Problem
¶ 173 A problem arose in the analysis of debitage because flake classifications defined in this Appendix were not used during the initial weeks of the survey in the Kin Klizhin survey area. Because the flake type data could not be easily reconstructed from the original forms, the debitage from these first weeks was coded into the computer as angular debris. Consequently, angular debris composes an unusually high and false percentage of all flakes at Kin Klizhin.
¶ 174 Also, during the first 2-3 weeks of data recording at Kin Klizhin, the lithic form did not contain categories for retouched/utilized pieces and hammerstones. These tool types were written onto the forms but were probably not consistently recorded during this period. For this reason, the tool assemblage from the Kin Klizhin survey area differs from the other areas.
Appendix 5.4: Description of Tool Types.
¶ 175 Core: Exhibits no bulb of percussion and has at least 2 negative flake scars.
- Bipolar: exhibits battering on opposite ends of the core.
- Hammerstone core: exhibits core attributes and battering.
¶ 176 Utilized/Retouched Piece: Exhibits edge damage or small regular flake removal from one or more edges.
¶ 177 Projectile Point: Bifacially worked artifact which contains a tip on one end and a probable haft element on the other end.
¶ 178 Scraper: Exhibits steep, even, unifacial retouch along one or more edges. Shape and retouch more formalized than retouched pieces.
¶ 179 Biface: Flakes have been removed from both sides of the artifact and flake removal is evident along all sides of the artifact.
¶ 180 Drill: Artifact with a projection which shows some sign of utilization.
- Formal: bifacial retouched implement with specialized shape.
- Informal: a projection which has not been specially shaped. May have notches on either side of the projection.
¶ 181 Hammerstone: Artifact which exhibits battering on one or more edges or surfaces but does not exhibit attributes of a core.
¶ 182 Axe: Large bifacially flaked implement.
¶ 183 Denticulate: Retouched piece, usually bifacial, in which the retouch forms a serrated edge.
¶ 184 Chopper: Bifacially worked tool which exhibits some sign of battering along the edge(s) where flakes have been removed.
¶ 185 Maul: Artifact which exhibits battering on opposite ends and is grooved for hafting. Groove is usually formed through grinding.
¶ 186 Polishing Stone: Small smooth pebble which could have been used to burnish pottery.
¶ 187 Tchamahia: Large often notched ground stone artifact made on a slate-like material which is often notched.
¶ 188 Mano: Hand-held groundstone artifact, has at least one ground or smoothed surface which is flat or convex in cross-section.
¶ 189 Metate: Large groundstone artifact with a concave grinding surface. Bottom portion of the mano/metate combination.