Previous | Table of Contents | Next
4.
Regional Patterns of Ceramic Variability in the San Juan Basin: Ceramics of the Chaco Additions Inventory Survey
Barbara J. Mills
¶ 1 This chapter reports on the analysis of data on 77,323 ceramic artifacts from 709 sites and 1,154 separate proveniences recorded during the inventory survey. The primary goals of the analysis are threefold, and each one of these research goals structures a major section of this chapter. The first goal is to describe the ceramic data base with respect to its spatial, temporal, and traditional ceramic typological variables. The second goal of the analysis is to identify patterns of ceramic production and distribution. Using a limited number of attributes, production and distribution patterns are identified and the implications of these patterns for models of ceramic trade and exchange in the San Juan Basin are explored. The final goal of the analysis is to identify functional patterning in the ceramic assemblages. Interpretations of site function are made on the basis of assemblage patterns and these interpretations are compared with the site and feature type assignments made in the field.
¶ 2 Supplementary to the data presented in this chapter are two data files at with the Chaco Culture National Historical Park Museum Archives at the University of New Mexico. The first, Appendix 4.1), presents counts by ceramic type and ceramic attributes for each provenience recorded during the survey. Each data line in this file represents a different ceramic type from a different provenience. The second file, not currently available electronically, presents summarized ceramic data, including total frequencies of ceramics, ceramic artifact densities, site type and selected proportional data. Each data line of this file represents a separate provenience, called an “ID.” These IDs are the smallest unit of assemblage recording and are a concatenation of the numerical codes for survey area, county, site number, deposit type, and feature number. This latter file also includes summarized lithic data and the date assignments made on the basis of the ceramic types present in the assemblage.
Field Recording Methods
¶ 3 All ceramic data were recorded in the field using noncollection procedures. Ceramics were recorded according to a typologically oriented taxonomic system and by two additional ceramic attributes.
¶ 4 The taxonomic system generally follows the “Rough Sort” system used by the Chaco Project research staff to classify excavated ceramics prior to the selection of samples for more intensive analyses. This Rough Sort system contrasts with many of the classificatory systems used previously in the Chaco area in that many traditionally recognized types have been collapsed due to difficulties in their field differentiation. By contrast, some of the more traditionally recognized types have also been further broken down in an effort to record variability of potential chronological importance. A full description of this classificatory system is presented by Toll and McKenna (1997). Appendix 4.2 of this report provides an abbreviated description of each ceramic category used during the present analysis, and the attributes used in their differentiation.
¶ 5 The two additional ceramic attributes recorded were ceramic form and temper type. In the field analysis ceramic form was recorded as bowl, jar, ladle, or other. All plain and corrugated graywares were assumed to be jars, a reasonable assumption based on the lack of bowl or other non-jar forms among excavated plain graywares from Chaco Canyon (e.g., McKenna and Toll 1984:Table 3.3; Toll 1984:Table 7; Toll and McKenna 1993:Tables 1.12a, 1.13a, and 1.14a), and on the fact that all grayware rim sherds encountered during the present project were of closed or jar forms. In the analyses described in this chapter, ladles and other special forms, such as effigies, have been collapsed into the “other” category.
¶ 6 Temper type was recorded in the field as one of two values: trachyte and nontrachyte. In addition, because temper type is one of the diagnostics for differentiating many of the ceramic wares identified during the survey, the frequencies of various wares may also be used to discuss variability in tempering material. This is an important aspect of the analysis of production and distribution patterns discussed in this chapter.
Spatial and Temporal Frameworks of the Ceramic Sample
¶ 7 This section presents the spatial and temporal units used in the ceramic analysis and the frequency of ceramic site components, site proveniences, and artifacts within these units. The criteria used to differentiate the various levels of spatial units are discussed in Chapter 1 and are only briefly summarized here. Because ceramic data were heavily relied on for establishing the temporal units, a more extensive discussion of the methods used to define temporal units is presented.
Levels of Spatial Units
¶ 8 Every ceramic artifact was recorded by several units of spatial proveniencing. The most inclusive unit is the survey area. Four survey areas are present: Kin Klizhin, Kin Bineola, Chacra Mesa, and the South Addition. Next is the unit of the site, a spatial cluster of artifactual and nonartifactual materials that potentially represents different material cultures and timespans. A total of 709 sites with ceramics was recorded. The next spatial level is the site component, representing that portion of the site assigned to the same culture and the same site type. There were 722 site components recorded at the 709 sites.
¶ 9 The fourth unit of spatial control is the provenience. In recognition of the fact that a single site component may represent multiple reoccupations, an effort was made in the field to record all spatial clusters of features and/or artifacts within a site component as separate proveniences. Although some sites, particularly small ones, were recorded as a single provenience, others contained multiple proveniences. This level of spatial control is the most useful unit for assemblage analyses. A total of 1,154 proveniences with ceramics are present in the database, each of which has a feature type assigned to it. The fifth and final spatial unit is deposit type, recorded as one of the following: 1) artifacts found as part of a general scatter, 2) artifacts found within a formal trash mound or midden, or 3) artifacts found within an architectural space.
Spatial Sampling
¶ 10 The present project was designed to be an inventory survey of four spatially separate areas. As such, within each of these areas, the area surveyed was a “100 percent sample.” Despite these good intentions, the ceramics discussed below may only be considered a partial sample. In addition to biases of discovery, the ceramics reported on below are biased toward those artifacts found within the context of a “site.” Although isolated occurrences or “IO’s” were recorded in the field, they are not included in the analyses discussed below.
¶ 11 In terms of within site sampling, in most cases all of the area of a particular provenience was sampled (see Chapter 1, “In-field Artifact Analysis,” for a description of the sampling procedure). In fact, 89 percent of the proveniences with ceramics were sampled at a 100 percent level. Exceptions to this are shown in Table 4.1 which lists the sampling fractions for those proveniences sampled at less than 100 percent. Although the number of proveniences sampled at a low fraction is small, it should be recognized that these are samples by area, and not necessarily by the number of ceramics present at the site or provenience. In many cases, such as within trash mounds, the number of ceramics not recorded may be quite high. A large number of proveniences were sampled at close to a 100 percent level, however, demonstrating that many of the sites contained relatively low densities of ceramics.
Table 4.1. List of proveniences sampled at less than 100% of total area of provenience with sampling fraction.
Cultural Affiliation
Culture by Frequencies of Site Components, Proveniences, and Artifacts
¶ 12 There are two major cultural groups which produced and/or used ceramics within the project areas—Anasazi and Navajo. Of the total number of ceramic artifacts recorded, 73,894 (96 percent) are of prehistoric (mainly Anasazi) manufacture, while 3,429 (4 percent) are of Navajo manufacture or use. This latter frequency includes 307 sherds of historic Puebloan manufacture. Based on the association of these historic Pueblo sherds with Navajo ceramics and/or features, they were likely brought into the survey areas by their Navajo users.
¶ 13 In terms of where these ceramics were actually found, the largest proportion of ceramic site components were recorded as Anasazi (78 percent). When the proportion of the sample of ceramic artifacts is considered, Anasazi sites produce an even greater sample (93 percent). By contrast, the proportion of Navajo sites is larger (12 percent) than the proportion of the total number of ceramics recorded at these sites (4 percent), demonstrating that on the average, Navajo sites have lower per site frequencies of ceramic artifacts. The remaining ceramics were recorded at sites where the association of ceramics with site features was ambiguous or unknown (Table 4.2). Most of these remaining ceramic artifacts are of Anasazi manufacture, but the associations of these ceramics with nonartifactual remains was ambiguous or unknown.
Table 4.2. Distribution of sample ceramic site components, proveniences, and artifacts by culture and survey area.
Distribution of Site Components by Culture and Area
¶ 14 Table 4.2 also shows the distribution of ceramics by survey area. In terms of both the proportion of ceramic sites and ceramic artifacts, only the Chacra Mesa sample diverges from the general pattern. At all three of the other survey areas—Kin Klizhin, Kin Bineola, and the South Addition—Anasazi remains are the most numerous, averaging greater than 90 percent of the total number of ceramic sites and 99 percent of the total number of artifacts. The Chacra Mesa survey sample contains the highest proportion of Navajo ceramic sites and artifacts, but Navajo materials still only account for 18 percent of the total ceramic sites and 12 percent of the total amount of ceramic artifacts within this area.
Distribution of Site and Feature Types by Culture
¶ 15 Most site types are almost exclusively associated with either Anasazi or Navajo sites, but seldom with both (Table 4.3). Exceptions to this include those cases where the remains were small and more ambiguous or where the apparent functions of the site were so similar that a separate site type could not be proposed. These exceptions include nonstructural artifact scatters of various material classes, hearths, cist/storage, road segments/trails, and rock art site types.
Table 4.3. Distribution of sample of ceramic site components by site type and culture.
¶ 16 The greatest number of the Anasazi site components were classified as habitation sites. These sites, of three rooms or more, account for approximately 25 percent of the total. Nonstructural “camp-like sites” account for an additional 19 percent. Thus, nearly one-half of the total Anasazi site components are distributed among two major site types, even though the variety of Anasazi site types is great. Navajo site types are less varied. But again, two site types, one structural (hogans) and one nonstructural (camps), account for a large percentage of the total (55 percent). Almost as many site components were assigned to the other/unknown category (N=74) as to Navajo (N=86). Most of the site types in the other/unknown category are camp-like sites (45 percent)—generally small, nonstructural sites where too few remains were present to assign a particular culture with certainty.
¶ 17 In addition to categorization by site type, each artifact was also assigned to a feature type. When the distribution of feature types is considered by culture, essentially the same trends as noted above are present, but in greater detail (Table 4.4). Again, most feature types tend to be associated with one of the two cultures. The distribution of feature types by the Other/Unknown culture category shows a large number of general site scatters. In many cases, these are overlapping distributions of Anasazi and Navajo artifacts on sites where both cultures are represented.
Table 4.4. Distribution of sample of ceramic site proveniences by feature type and culture.
Distribution of Anasazi Ceramic Sample by Spatial Units
¶ 18 Spatial parameters of the Anasazi sample are discussed below in terms of grouped site types, grouped feature types, and deposit types. The site and feature types were combined on the basis of similar morphological characteristics, as listed in Tables 4.5 and 4.6. Twenty-six site types were grouped into nine site type groups, and 43 feature types were grouped into 13 feature type groups.
|
Table 4.5. Classification of site types into site type groups. |
|
|---|---|
| Site Type Group | Site Type Members |
| Structural | |
| Large Structure | Habitation |
| Chacoan Structures/Great Kivas | Great Kiva/Habitation |
| Chacoan Structure | |
| Isolated Great Kiva | |
| Small Structures | Fieldhouse |
| Ledgeroom(s) | |
| Fieldhouse/Habitation | |
| Nonstructural | |
| Roads or Trails | Road Segment/Trail |
| Stairs | |
| Scatters | Sherd Scatter |
| Sherd/Lithic Scatter | |
| Lithic Scatter | |
| Hearths | Hearth |
| Camp-like Site | |
| Baking Pits | Baking Pit |
| Storage Features | Cist/Storage |
| Other | Camp, Water Control, Shrine, Sweat lodge, Hogan, Rock Art, Animal Husbandry, Other, Unknown Navajo, Unknown Anasazi |
|
Table 4.6. Classification of feature types into feature type groups. |
|
|---|---|
| Feature Type Group | Feature Type Members |
| Structural | |
| Large Structure | Roomblock |
| Kiva | |
| Chacoan Structures/Great Kivas | Great Kiva |
| Chacoan Structure | |
| Small Structures | Fieldhouse |
| Ledgeroom(s) | |
| Fieldhouse/Water Control | |
| Unknown Structure | |
| Ramada/Lean-to | |
| Pithouse | Pithouse |
| Nonstructural | |
| Artifact Scatter | Sherd Scatter |
| Sherd/Lithic Scatter | |
| Lithic Scatter | |
| Lithic Concentration | |
| Pot Drop | |
| General Site Scatter | |
| Hearth | Hearth |
| Baking Pit | Baking Pit |
| Storage Feature | Cist |
| Storage Room | |
| Roads/Trails | Road |
| Trail | |
| Stairs | |
| Slab Scatter | Slab/Fire Cracked Rock Scatter |
| Water Control | Canal/Ditch |
| Dam | |
| Check Dam | |
| Water Control | |
| Shelter | Rockshelter |
| Other | Camp, Shrine, Hogan, Sweat lodge, Rock Art, Unknown Feature, Corral, Cairn, Quarry, Burial, Stone Circle, Ash Heap, Other, Unknown |
Spatial Distribution of Site Type Groups
¶ 19 When the breakdown by site type groups is considered (Table 4.7), the Chacra Mesa area distinguishes itself from all three of the other survey areas. Two site type groups are considerably more abundant in the Chacra Mesa area—hearth/camps (36 percent) and baking pits (12 percent). Of the three areas of Kin Klizhin, Kin Bineola, and the South Addition, Kin Bineola shows the most divergence from the other two. The Kin Bineola area has a higher proportion of large structural site components while Kin Klizhin and the South Addition have higher proportions of components assigned to scatters and hearth/camps. In addition, the Kin Bineola area has more Chacoan structure/great kiva components than any other area, which contribute over 18 percent of the total artifacts recorded in that area.
Table 4.7. Frequency of Anasazi ceramic components and artifacts by grouped site type and survey area.
¶ 20 Despite the above contrasts, one of the clearest patterns among all four survey areas is the large percentage of artifacts recorded at a single site type group. In all four areas, over 50 percent of the ceramic sample comes from large structural sites.
Spatial Distribution of Feature Type Groups
¶ 21 There are many parallels between the patterns noted above for the grouped site types as compared to the grouped feature types (Table 4.8), parallels which are not surprising given that the constellation of feature types present at a site were major criteria for assigning site types. Despite some redundancy, feature type data are important because of direct artifact associations with specific aspects of site morphology.
Table 4.8. Frequency of Anasazi ceramic proveniences and artifacts by grouped feature types and survey area.
¶ 22 Three feature type groups account for the majority of both proveniences and artifacts: large structures, small structures, and artifact scatters. Combined, these three feature types comprise 70 percent of the total number of proveniences and 79 percent of the artifacts. At Kin Bineola, large structures are proportionately the most common proveniences; at Kin Klizhin, small structures and artifact scatters predominate; while at Chacra Mesa and the South Addition, most proveniences are artifact scatters. Only 15 percent of the proveniences with ceramics were large structures, yet 42 percent of the ceramic artifacts were recorded at this feature type.
¶ 23 As with the site type data, the Chacra Mesa sample diverges from the other three survey areas. Chacra Mesa has more variation in feature types, as well as the largest percentages of hearths, slab scatters, baking pits, artifact scatters, rock shelters, roads/trails, and “other” proveniences than any of the other three areas.
Spatial Distribution of Deposit Types
¶ 24 Deposit types were discriminated in the field to differentiate artifacts found in a formalized trash mound from those found within rooms and features and from those found in a general scatter. Inspection of ceramic proveniences and artifacts by deposit type and area indicates that over 70 percent of the proveniences and over 50 percent of the artifacts were recorded in refuse scatters (Table 4.9). This general pattern holds true for all areas except Kin Bineola, where the majority of ceramics recorded were within formalized trash deposits.
Table 4.9. Frequency of Anasazi ceramic proveniences and artifacts by deposit type and survey area.
Temporal Frameworks
¶ 25 Temporal frameworks used during the ceramic analysis are of three general classes. First, the general separation of prehistoric from historic time periods was made and used during all aspects of the ceramic analysis. This division was based on the cultural affiliation of the ceramic sample. Prehistoric ceramics are those of Ancestral Pueblo or Anasazi manufacture, while historic ceramics are of Navajo manufacture or, in the case of the Historic Puebloan sherds, of Navajo use. Another temporal framework was established through the assignment of site provenience beginning and ending dates. The third temporal framework in the analysis is the use of five ceramic date groups for the Anasazi assemblages, derived from groupings of the site provenience beginning and ending dates. The criteria used to establish the temporal frameworks and the distribution of the sample of site proveniences and artifacts within each are discussed below.
Assignment of Date Ranges
¶ 26 The assignment of date ranges to each site provenience was made through the assessment of overlap in date ranges for each ceramic type present in that particular assemblage. Date ranges for all recorded ceramic types are shown in Table 4.10, along with the total frequencies of that type within each survey area. The estimated dates of production shown in this table are largely derived from the bibliographic sources cited within the descriptions of each ceramic type in Appendix 4.2, with few exceptions. Exceptions include the date ranges for Cibola Grayware, which are based on research conducted in Chaco Canyon by National Park Service (NPS) archaeologists (Toll and McKenna 1997).
Table 4.10. List of ceramic codes, estimated date ranges, and occurrence frequencies for ceramic types recorded during inventory survey by survey areas.
¶ 27 There are three general assumptions made about the date ranges assigned to each site. First, it is assumed that there are no significant biases in the typological identifications (and the estimated dates dependent upon the identifications) made by the three different field recorders. Because a noncollection policy was used in the field, it is difficult to assess the impact of this potential bias on the ceramic data. However, Peter McKenna was the in-field ceramic analyst both seasons and spent one week each season on the same crew as the two other analysts (Daisy Levine and Barbara Mills). Second, it is assumed that the date ranges for ceramic types and/or wares that are not based on chronometric data collected from the central San Juan Basin may be applied to the ceramics from the survey areas. Last, it is assumed that the presence or frequency of specific ceramic types used for temporal diagnosis are not substantially affected by nonchronological factors. This assumption is undoubtedly incorrect to some degree, because factors such as site function contribute to variation in the relative frequencies of ceramic types. For this reason, the functional analysis discussed at the end of this chapter will not use temporal subdivisions as initial units of analysis but as units of comparison after the identification of ceramic assemblage groups.
Assignment of Date Groups
¶ 28 Date groups were established for the Anasazi sample through the identification of clustering in the ranges discussed above. Due to the large number of overlapping ranges, visual inspection to determine date groups proved difficult and a statistical method was chosen instead. The main goal of the statistical analysis was to place proveniences into groups which maximized heterogeneity between, and minimized heterogeneity within, groups. The sample used for this analysis consisted of all proveniences with assigned beginning and ending dates of 200 years or less. Ranges greater than 200 years were deleted in order to eliminate probable long-occupied sites and/or proveniences. Ranges of 200 years or less are not assumed to represent single occupations, but are in many cases the smallest ranges able to be ceramically determined for certain portions of the temporal continuum.
¶ 29 Date clusters were determined through a two step process. The first step entailed the use of statistical procedures for determining the appropriate number of clusters in the sample. This was accomplished by using the CLUSTER procedure of the Statistical Analysis System (SAS). Once the number of clusters present in the sample had been identified, the second step entailed the assignment of each assemblage to one of the date clusters using the FASTCLUS procedure of SAS.
¶ 30 A total of 736 date ranges were used as input variables in the CLUSTER procedure using Ward’s minimum variance hierarchical method (SAS Institute 1982). This procedure begins by placing all variables in one cluster and then increases the number of clusters by one at each subsequent iteration. Data on clusters one through 15 are shown in Table 4.11.
|
Table 4.11. Results of cluster analysis determining number of clusters in date range data — Ward’s average linkage hierarchical method. |
|||
|---|---|---|---|
| Number of Clusters | Frequency of New Cluster | R-Squared | Cubic Clustering Criterion |
| 15 | 34 | 0.990920 | 7.4610 |
| 14 | 150 | 0.990045 | 6.9227 |
| 13 | 130 | 0.988935 | 6.1444 |
| 12 | 71 | 0.987652 | 5.4206 |
| 11 | 100 | 0.986232 | 4.9119 |
| 10 | 67 | 0.983849 | 2.3140 |
| 9 | 74 | 0.981280 | 1.7779 |
| 8 | 187 | 0.978577 | 2.0168 |
| 7 | 64 | 0.975695 | 3.1230a |
| 6 | 317 | 0.968412 | 2.4613 |
| 5 | 174 | 0.956646 | 1.9804 |
| 4 | 384 | 0.935513 | 1.7256 |
| 3 | 178 | 0.909087 | 5.8414 |
| 2 | 558 | 0.795395 | 6.1120a |
| 1 | 736 | 0.000000 | 0.0000 |
| aIndicates peaks in the Cubic Clustering Criterion when plotted against number of clusters. | |||
¶ 31 In order to determine the appropriate number of clusters, a plot of the number of clusters by the Cubic Clustering Criterion (CCC) was inspected. Peaks on the plot with a CCC greater than 2 (starred in Table 4.11 and plotted on Figure 4.1) were interpreted as significant if the sample sizes within that cluster were greater than 10 (SAS Institute 1982:420). The two peaks present are at two and seven clusters. The use of only two clusters was not adequate for temporal control and therefore a seven cluster solution was initially chosen. When the seven cluster solution was input into the FASTCLUS procedure, too many overlapping date groups resulted, with two date groups having fewer than 30 proveniences. This suggested that the number of clusters could be decreased. A five cluster solution was therefore selected instead.
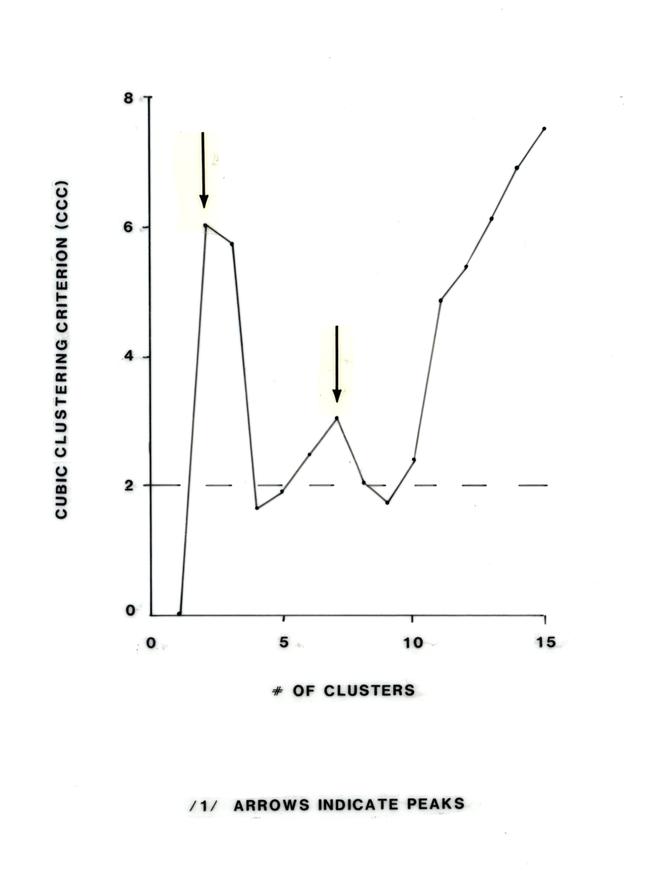 |
Figure 4.1. Plot of cubic clustering criterion by number of clusters. |
¶ 32 Using the K-means method available in the FASTCLUS procedure, the 736 pairs of dates were assigned to five discrete clusters. The initial seeds and cluster means of each of the two variables—beginning date and ending date—are shown in Table 4.12a. Also shown are the date group values which were assigned to recode the clusters in chronological order.
|
Table 4.12a. Results of cluster analysis assigning members to date groups using K-means method. |
||||||
|---|---|---|---|---|---|---|
| Cluster | No. of Members | Initial Seeds | Cluster Means | Date Group | ||
| Begin Date | End Date | Begin Date | End Date | |||
| 1 | 124 | 550 | 700 | 554.032 | 751.613 | 100 |
| 2 | 47 | 1200 | 1300 | 1127.128 | 1232.979 | 500 |
| 3 | 331 | 1100 | 1125 | 1028.021 | 1131.798 | 400 |
| 4 | 169 | 850 | 925 | 889.053 | 1025.000 | 300 |
| 5 | 65 | 700 | 800 | 703.077 | 879.231 | 200 |
¶ 33 Comparison of the date groups derived from the cluster analyses with the discrete temporal codes used for the analysis of NPS excavations in Chaco Canyon shows strong similarities, particularly toward the latter half of the prehistoric sequence. The two earliest date groups identified during the cluster analyses include more than one of the temporal groups used in the excavation analyses, but later date groups may be correlated on a one to one basis (Table 4.12b, see also Figure 1.2).
|
Table 4.12b. Concordance of date groups used in analysis of survey data with temporal groups used for National Park Service Chaco Canyon excavation analyses. |
|||
|---|---|---|---|
| Survey Date Group | Date (A.D.) | Chaco Temporal Code | Date (A.D.) |
| 100 | 550-750 | 02 | 500s |
| 03 | 600s | ||
| 24 | 600-820 | ||
| 200 | 700-880 | 04 | 700-820 |
| 300 | 890-1025 | 05 | 820-920 |
| 06 | 920-1020 | ||
| 400 | 1030-1130 | 07/18 | 1020-1120 |
| 500 | 1130-1230 | 08 | 1120-1220 |
| 12 | 1220-1320 | ||
¶ 34 Comparative analyses of Cibola White Ware stylistic changes through the two date group sequences demonstrate that the two dating systems have a high level of comparability (Figures 4.2a and 4.2b). Basketmaker III-Pueblo I black-on-whites predominate through the late A.D. 700s in both sequences, while Red Mesa Black-on-white peaks during the mid-to-late 900s. After this, Cibola White Ware types are additive rather than successive, with a number of at least partially contemporaneous Cibola White Ware styles, including Gallup, Puerco, Escavada, Chaco, and Chaco-McElmo black-on-whites. One major contrast of the survey data with the excavated sample is that the proportion of Chaco and Chaco-McElmo black-on-whites is considerably higher in the excavated sample. This is probably due to the high frequency of sherds in the excavated sample from the site of Pueblo Alto which has high proportions of Chaco and Chaco-McElmo black-on-whites.
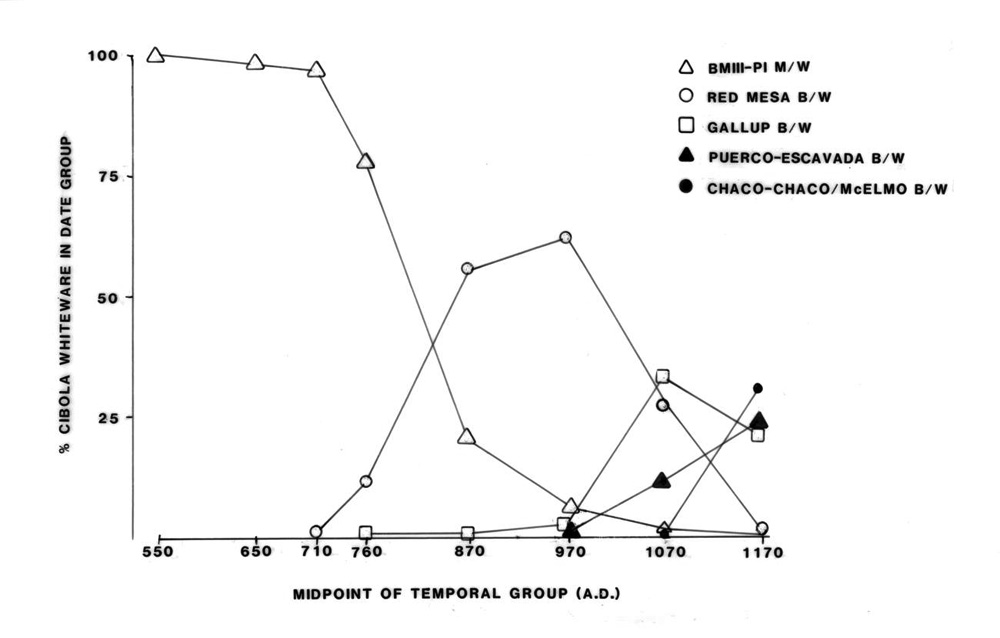 |
Figure 4.2a. Proportions of Cibola White Ware styles by date group midpoint showing Chaco Canyon excavated proveniences and temporal groups. |
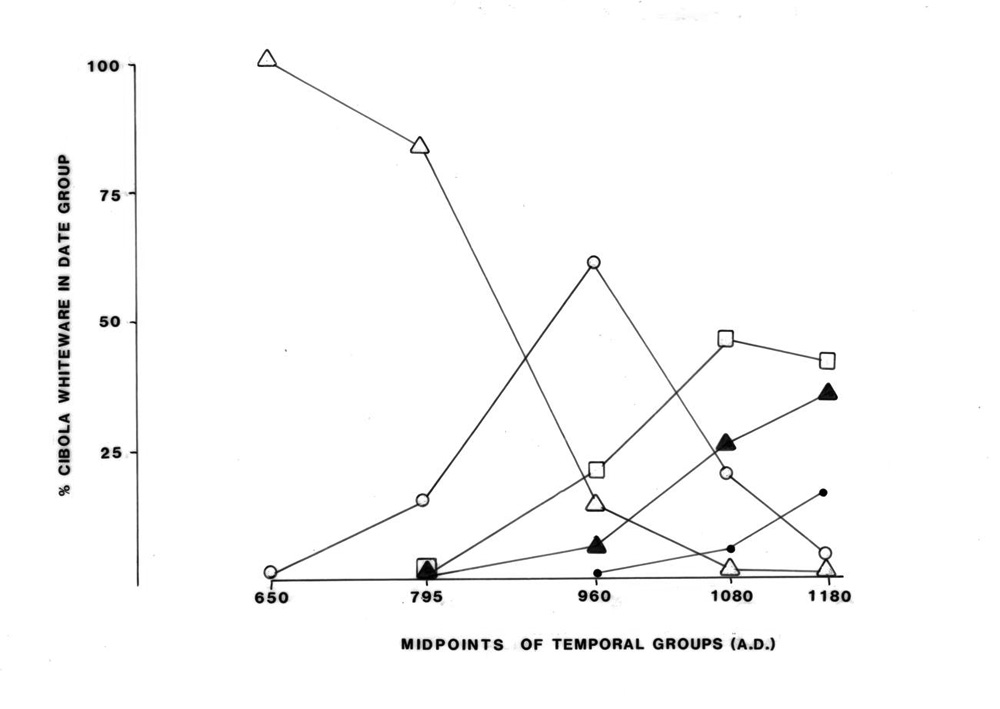 |
Figure 4.2b. Proportions of Cibola White Ware styles by date group midpoint showing inventory survey proveniences and temporal groups. |
¶ 35 Thus, the Anasazi date groups derived from the cluster analysis are not only satisfying on the basis of the clustering procedures, but also in terms of the expectations for Cibola White Ware style changes through time based on excavated data from Chaco Canyon. This ensures that comparisons with the temporal groups used in Chaco Canyon may be made with relative ease.
Temporal Distribution of Navajo Sample
¶ 36 Navajo assemblages were also assigned date ranges based on the ceramic type frequencies. The frequency of Navajo proveniences by beginning and ending dates is shown in Table 4.13. As this table shows, more proveniences fall into the 1700 to 1850 date range than any other time period. In addition, there appears to be very little evidence from the ceramic data for occupation dates after1900. However, it should be remembered that these are dates based on ceramic dating, and do not include the important dating evidence from items of Anglo-American manufacture. Because Navajo manufacture of pottery declined after the availability of metal items, particularly after the railroad system was built across New Mexico in the 1880s, nonceramic items are more important for site dating than are ceramic artifacts for this later period. Dating of Navajo sites via the full inventory of historic artifacts is discussed in Chapter 6 of this volume.
|
Table 4.13. Frequency of Navajo proveniences by ceramic date ranges. |
||
|---|---|---|
| Date Range (A.D.) | Proveniences | |
| No. | % | |
| 1600-1680 | 2 | 1.46 |
| 1600-1750 | 1 | 0.73 |
| 1700-1800 | 3 | 2.19 |
| 1700-1850 | 60 | 43.80 |
| 1700-1900 | 1 | 0.73 |
| 1750-1850 | 8 | 5.84 |
| 1750-1900 | 4 | 2.92 |
| 1750-1935 | 2 | 1.46 |
| 1800-1850 | 1 | 0.73 |
| 1800-1900 | 8 | 5.84 |
| 1800-1925 | 1 | 0.73 |
| 1825-1875 | 1 | 0.73 |
| 1825-1950 | 1 | 0.73 |
| 1870-1920 | 2 | 1.46 |
| 1870-1925 | 2 | 1.46 |
| post-1850 | 1 | 0.73 |
| unknown | 39 | 28.74 |
| TOTAL | 137 | 100.0 |
Temporal Distribution of Anasazi Sample by Survey Area
¶ 37 The distribution of the sample of Anasazi ceramic proveniences and artifacts through time by the four survey areas shows some interesting and important patterns (Table 4.14). The A.D. 1030 to 1130 date group is clearly the best represented of the five date groups, both in terms of the number of ceramic proveniences and the number of ceramic artifacts. This date group accounts for over 40 percent of the total in each of these two samples. These high proportions are even more dramatic considering the fact that the date groups are not of equal duration and that this range is one of the shortest. The A.D. 890 to 1025 date group is the second most numerous, accounting for 23 percent of the total proveniences and 25 percent of the artifacts. None of the other date groups accounts for more than 20 percent of the total samples, with the A.D. 1130 to 1230 range being the smallest of the five.
Table 4.14. Distribution of sample of Anasazi ceramic proveniences and artifacts by survey area and date group.
¶ 38 These temporal patterns are not homogeneous among the four survey areas. An unusually large proportion of the Chacra Mesa proveniences and artifacts date to the A.D. 550 to 750 period. This proportion is even more dramatic when the sample of this date group alone is considered (the column percent in Table 4.14). Over 70 percent of the proveniences and artifacts of this period were recorded within the Chacra Mesa area. The South Addition has a relatively high proportion of proveniences and artifacts falling within the A.D. 550 to 750 period, but nowhere near the size of the samples from Chacra Mesa.
¶ 39 One factor which may be affecting the proportional distributions of proveniences through time is the method of field recording. Proveniences within a site were primarily distinguished on the basis of spatial separateness. Thus, a single roomblock of several contiguous rooms would be recorded as one provenience, while an area with many hearths and/or baking pits might have been recorded as multiple proveniences because they could be spatially distinguished. Because the latter type of site generally dates earlier than those with surface structures of multiple contiguous rooms, the frequency of early proveniences may be slightly inflated.
¶ 40 The A.D. 700 to 880 period is not well represented in most of the areas, at least in part because this date group overlaps with the preceding one. It is best represented at Kin Bineola, where the number of ceramic proveniences and ceramic artifacts increases dramatically over the A.D. 550 to 750 period making up 17 percent of the proveniences and 20 percent of the artifacts within that area.
¶ 41 The following period—A.D. 890 to 1025—is well represented in all areas. It is the peak period in proportions of proveniences in the South Addition sample. By contrast, the Kin Klizhin area has the largest proportion of artifacts assigned to this date group, but these artifacts were recorded within proportionally fewer proveniences.
¶ 42 The A.D. 1030 to 1130 date group numerically contains the largest number of both ceramic proveniences and ceramic artifacts. Kin Klizhin has the highest proportion of its proveniences assigned to this date group, but both Kin Bineola and the South Addition have greater proportions of their total ceramic artifacts dated to this time period.
¶ 43 The period from A.D. 1130 to 1230 is the least well represented, both in terms of number of proveniences and number of artifacts. No proveniences and therefore no artifacts were assigned to this period in the South Addition. The Kin Klizhin and Chacra Mesa areas show the highest representation of proveniences and artifacts dating to this period, but these samples never exceed 15 percent of their individual area totals.
¶ 44 Because the date groups were assigned to only those proveniences with time spans of 200 years or less, histograms were prepared for all proveniences with assigned beginning and ending dates to look at the data more graphically (Figures 4.3a-d). The series of histograms of date range midpoints by each area show the same important temporal trends in the data among the four areas, although at a finer grain. Again, Chacra Mesa is distinctive due to the presence of two large modes, one early and one late. In addition, there are peaks in the data in the mid-to-late 1000s. Early, but very small peaks in the late A.D. 600s and 700s are evident at Kin Klizhin, Kin Bineola, and the South Addition, a pattern not discernible from the date group data. A final point of interest offered by the histograms and not present in the date group data are the relative dates of the late peaks. Kin Klizhin peaks between A.D. 1100 and 1149, while the other three areas have their peaks between A.D. 1050 and 1099. Given the vagaries of the ceramic cross-dating method used here, these differences may not be significant, only suggestive.
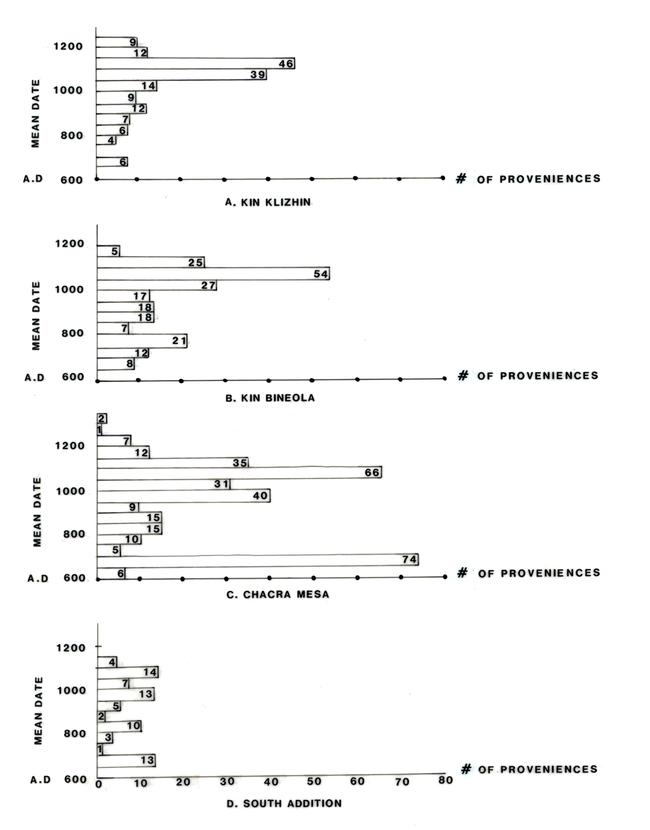 |
Figure 4.3a-d. Histogram of mean dates of Anasazi ceramic proveniences by survey area. |
Temporal Distribution of Anasazi Sample by Site and Feature Type
¶ 45 Tables 4.15 and 4.16 show the distribution of ceramic artifact frequencies by site or feature types, survey area, and date group. As with tables presented earlier in this chapter that show frequencies or proportions for both site types and feature types, site types are comprised of one or more feature types. A one-to-one correlation between the two spatial units is not possible because any specific feature type may have been grouped with other feature types into different site types. The site type designation was made on the basis of the constellation of the feature types present, not necessarily the presence/absence of any one feature type.
¶ 46 The distribution of the sample of Anasazi ceramics through time by survey area and site type groups shows that large structures tend to contribute the majority of ceramics throughout almost every time period (Table 4.15). In the South Addition during the A.D. 700 to 880 period, the large structure feature type accounts for 100 percent of the artifacts of this time period and area. It should be remembered, however, that the large structure category covers a wide range of variability, including all surface structures of three rooms or more and all pithouses. In the Kin Bineola area during the A.D. 550 to 750 period, this site type contributes an extreme value of almost 98 percent of all ceramic artifacts, but the total sample for this date group within this area is low (only 871 artifacts). Rarely does the site type group of large structures contribute less than 50 percent of the total ceramics in any single time period by area. Exceptions to this, however, are present. Artifacts associated with large structures within the Chacra Mesa A.D. 700 to 880 and 890 to 1025 samples are very low. During these periods, the site type group of hearths within the Chacra Mesa sample contains a larger proportion of artifacts than any other area.
Table 4.15. Frequency of Anasazi ceramics by date group and site type group for each survey area.
¶ 47 Chacoan structures/great kivas, when present, contribute relatively high frequencies of ceramics to the total ceramics in a date group. This site type group contains 24 percent of the ceramics within the A.D. 890 to 1025 period and 17 percent within the 1030 to 1130 period at Kin Bineola, and 23 percent within the A.D. 1130 to 1230 period at Chacra Mesa.
¶ 48 The frequency of Anasazi ceramics by date group and grouped feature types is shown in Table 4.16. Although large structures are again contributing a large sample, these proportions are low for certain time periods and areas, particularly in the early Chacra Mesa and South Addition samples. Artifact scatters, including general site scatters associated with structural features at a site component, have relatively high frequencies, but not consistently within any one date group. The Kin Klizhin area has particularly low proportions at this feature type during the A.D. 700 to 880 and 890 to 1025 periods.
Table 4.16. Frequency of Anasazi ceramics by date group and feature type group for each survey area.
¶ 49 Pithouses have high proportions of ceramics within the A.D. 550 to 750 Chacra Mesa sample (over 60 percent of the artifacts of that time period). The same feature type accounts for only 23 percent of the artifacts in the same time period at Kin Klizhin, dropping off in the next time period to 11 percent. By contrast, the Kin Bineola area has greater proportions of artifacts associated with pithouses during the period of A.D. 700 to 880, a sharp rise from the preceding A.D. 550 to 750 period. The Chacoan structures/great kivas feature type data reveal similar patterns to the site type data; when present, they account for relatively high proportions of the total ceramics assigned to a particular date group.
Intrasite Temporal Variability by Deposit Type
¶ 50 Windes (1982) has noted a pattern in the Chaco area that suggests there may be significant differences in ceramic dates derived from trash mound versus roomblock assemblages on the same site. In his study, ceramic frequency data derived from sites with both structural remains and clearly defined trash mounds showed that the trash mound deposits were consistently earlier than is indicated by samples from the structures themselves. Windes interpreted this lag in the dates from structures as representing the assemblages of the last occupation at the site. Thirty-eight sites recorded during the present survey had both structural and trash mound deposits. The assemblages from these different deposits were recorded separately. Comparison of their date ranges indicated that 22 (57.9 percent) of these sites showed no differences between the date ranges from structure/features compared with those from their associated trash mounds. Ten sites (26.3 percent) had structure/feature dates that were later than their associated trash mounds, while only 5 (13.2 percent) had structure/feature dates earlier than their associated trash mounds. One site with multiple features had one early trash mound and one late. Thus, the trend noted by Windes was present at only about one quarter of the sites.
Ceramic Artifact Densities
¶ 51 Anasazi ceramic artifact densities were calculated for two of the spatial units of recording: site components and site proveniences. In both cases, only the areas actually sampled during ceramic artifact recording contribute to the calculation of ceramic densities. The density of Anasazi ceramics at site components was calculated by summing the area (in square meters) of all of the proveniences sampled at the site component and dividing that by the total number of ceramic artifacts recorded within those areas. Densities for site components are grouped by site type and survey area in Table 4.17. The density of Anasazi ceramics at site proveniences was also calculated, and data for this unit of spatial recording is shown in Table 4.18, grouped by feature type and survey area. The areas used for site proveniences are the same as those summed for the calculations made at site components.
¶ 52 The density of ceramic artifacts at site components by area and site type groups shows that overall, artifact density is low (Table 4.17). The site type group of Chacoan structures/great kivas within the Kin Bineola area has the highest ceramic densities, with a mean density of 4.91 ceramics per square meter. Large structures within the Kin Klizhin area also have high densities, with a mean of 2.04. The only other area/site type combination with a mean density greater than 1 is the large structure category of the South Addition (mean of 1.02). In fact, of the remaining 30 area/site type group combinations, only four have densities between 0.50 and 1.0 ceramics per square meter. Lowest densities, excluding categories with sample sizes of less than five, are found at sites classified as hearths, roads or trails, scatters, or “other,” nearly all of which are nonstructural site type groups.
Table 4.17. Density of Anasazi ceramics at components by grouped site type and survey area.
¶ 53 Density of ceramics by grouped feature types more directly reflect densities associated with specific site features (Table 4.18). Large structures within all areas have the highest densities as a feature type group. Apart from the large structures, the highest mean density of any one feature type/area combination is for Chacoan structures/great kivas within the Kin Bineola area. By contrast to the patterns noted for site type groups, some feature types with structures have low densities. Lowest densities with sample sizes greater than five are found at small structures, hearths, slab scatters, baking pits, and storage features.
Table 4.18. Density of Anasazi ceramics at site proveniences by grouped feature type and survey area.
Patterns of Production and Distribution
¶ 54 One of the main problems to be addressed with ceramic data from the inventory survey is the identification of patterns of trade and exchange and the interpretation of these patterns in terms of the social mechanisms responsible for their initiation and maintenance. This is a particularly acute problem for the San Juan Basin because certain aspects of trade and exchange, such as redistribution, have often been cited as major, if not causal factors in the development of the Chacoan “phenomenon” (Altschul 1978; Grebinger 1973; Judge 1979; Judge et al. 1981). Although the primacy of redistribution in the development of the “complex cultural ecosystem” (Judge 1979) of Chaco Canyon has been challenged (e.g., Cameron 1984; Powers 1984; Sebastian 1983a; Toll 1981, 1984), the identification and interpretation of patterns of trade and exchange remain important for understanding the Chaco regional system. In this section, the characteristics of ceramic procurement and the distribution of ceramics inferred to be locally versus nonlocally produced are discussed with the goal of presenting data which may inform on current problems of trade and exchange in the San Juan Basin. Most previous discussions of ceramic trade and exchange models have combined two groups of variables—those of production and those of distribution. But these are two very important and separate variable classes and as such, are analytically separated in the analyses discussed below.
Patterns of Production
¶ 55 Analyses of production patterns in the San Juan Basin have largely been limited to the identification of different source areas. Discussion of what was being produced and when, have been less intensely studied than the question of where ceramics were produced. Distributional studies, then, have primarily used ceramic classes proposed to represent differences in location of production, but not what these classes might have been used for. In this section, patterns of production, including locational, functional, and temporal parameters, are outlined first. Then, their distribution through time and space is considered.
Ceramic Wares and Locations of Production
¶ 56 Most of the ceramics recorded at Anasazi sites in the survey areas may be classified by ceramic ware. The major ceramic wares occurring in the project areas include Cibola Gray Ware and White Ware, Chuska Gray Ware and White Ware, Mesa Verde White Ware, Tusayan White Ware, San Juan Red Ware, White Mountain Red Ware, and Tsegi Orange Ware. Largely because of Anna Shepard’s pioneering work in the late 1930s (Judd 1954; Shepard 1939), these wares are known to have geographical significance.
¶ 57 Cibola Gray Ware and White Ware dominate in the assemblages recorded during the inventory survey. About 90 percent of the ceramics were classified as one of these two wares, with nearly 60 percent of these classified as gray wares. Chuska Gray Ware was the next most common ware, totaling just over 6 percent. Mesa Verde White Ware totaled just over 1 percent, but Chuska White Ware, Tusayan White Ware, San Juan Red Ware, White Mountain Red Ware, and Tsegi Orange Ware were much less common, each totaling less than 1 percent of all wares recorded (Table 4.19).
¶ 58 Several studies have been conducted to identify the areas of production of these wares, building on the patterns first identified by Shepard (e.g., Garrett and Franklin 1983; Loose 1977; Mills et al. 1997; Toll et al. 1980; Vivian and Mathews 1964; Voll 1964; Warren 1967; Windes 1977). These studies have relied on two principal methods of compositional analysis: 1) clay oxidation studies and 2) petrographic or binocular analyses of temper.
|
Table 4.19. Frequencies of Anasazi ceramics by ware. |
||
|---|---|---|
| Ware | Frequency | Per Cent |
| Cibola Gray Ware | 43,100 | 58.34 |
| Chuska Gray Ware | 4,897 | 6.63 |
| Cibola White Ware | 22,544 | 30.51 |
| Chuska White Ware | 696 | 0.94 |
| Mesa Verde White Ware | 1,087 | 1.47 |
| Tusayan White Ware | 311 | 0.42 |
| San Juan Red Ware | 264 | 0.36 |
| White Mountain Red Ware | 653 | 0.88 |
| Tsegi Orange Ware | 81 | 0.11 |
| Other/Unknown Anasazi | 247 | 0.33 |
| TOTAL | 73,880 | 99.99 |
¶ 59 Accurate location of areas of production through compositional analyses such as the above two methods rely on several variables. One of the most important of these involves the spatial localization of raw materials. Raw materials used in ceramic production that occur in a spatially constricted area are more easily identified as to provenience than are materials occurring over a wide area. Compositional analyses generally proceed by the process of elimination; samples of raw materials with known locations are compared to the materials used in ceramic production to see if they have the same characteristics. If not, then the analyst is able to say that the artifact was probably not made in the area where that raw material occurs. Even this negative inference may be incorrect if the raw materials are transported or if all of the potential clay and temper raw material variability in an area is not sampled.
¶ 60 Interpretations of areas of production for those wares occurring within the project areas are subject to the above problems. In fact, the production areas of the most abundant wares present, Cibola Gray Ware and Cibola White Ware, cannot be narrowed down to very specific locations because of the widespread distribution of the raw materials used in their production. The size of the production areas of Cibola Gray and White Wares was probably larger than that of any of the other wares occurring in the survey areas. The assumption that these two wares are local is probably incorrect in many cases. As Toll el al. (1980:97) point out:
The “Cibola area” is hundreds of kilometers across. In the case of Chaco Canyon temper studies indicate that many Cibola ceramics were imported from considerable distances (40 km or more), meaning that a substantial (though not precisely specifiable) percentage of “local” ceramics are hardly local.
¶ 61 Clay oxidation studies indicate that the Cibola Gray Ware and White Ware are made from similar clays (Garrett and Franklin 1983). Because these buff-firing clays occur in the Chaco Canyon area, it is probable that many vessels of these wares were made at Chaco or nearby (Toll et al. 1980; Vivian and Mathews 1964; Windes 1977). But unfortunately, the production areas of these wares may have been very large, as buff-firing clays are widespread throughout the central San Juan Basin. Temper studies are equally unrevealing for the Cibola Gray and White Wares. The primary tempering materials are sherd, sand, and sandstone, all of which are widely distributed and show few unique characteristics suitable for sourcing studies. Thus, because of poor geological resolution, the probable areas of production within the central San Juan Basin cannot be narrowed down any further.
¶ 62 Fortunately, the identification of production areas for at least two other wares commonly occurring in the central San Juan Basin, Chuska Gray Ware and Chuska White Ware, is methodologically more secure. There is widespread agreement among analysts that rocks of sanidine basalt or “trachyte” occur in a geographically limited area in and around the Chuska Mountains. The presence of this rock as ceramic temper is usually interpreted as indicating that the tempering material, if not the entire ceramic vessel, came from the Chuska area (Garrett and Franklin 1983; Judd 1954; Loose 1977; Mills et al. 1997; Shepard 1939; Warren 1967; Windes 1977).
¶ 63 Clay oxidation studies support the hypothesis that the vessels were manufactured in the Chuska area. Chuska Gray Ware and Chuska White Ware both tend to turn red when fully oxidized (Garrett and Franklin 1983; Windes 1977). Red firing clays are indicative of large amounts of iron in the clay and are generally found in areas where there are parent materials of igneous rock. As noted above, the clays in Chaco Canyon are buff firing. The closest red firing clays are to the west of Chaco in drainages of the Chuska Mountains, and to the north, in the valleys draining into the San Juan River from southern Colorado (Toll et al. 1980). Thus, the co-occurrence of red-firing clays in the areas where trachyte is known to occur suggests that the vessels were made in the Chuska area. This also fits with cross-cultural ethnographic data compiled by Arnold (1985) which shows that tempering materials are rarely transported over more than 10 km to a ceramic production locale.
¶ 64 Clay and temper studies of the Mesa Verde White Ware point to production areas to the north of the Chaco area. A key question here, however, is how far north. The andesite-diorite tempers and red-firing clays typical of sherds of this ware occur in a widespread area of southwestern Colorado and northwestern New Mexico. Ceramic refiring studies conducted by Franklin (1979a, 1979b, 1979c) and Wilson (2006) using samples from the Salmon Ruin, 82 km north of Chaco Canyon, are equivocal. Mesa Verde White Ware may have been made there based on the available evidence, but it may have been made in other areas as well. Shepard’s (1939) studies in the northern drainages of the San Juan indicate that Mesa Verde wares were abundantly produced in that area. Even if the clays were obtained as close as the San Juan River, however, the distance from Chaco Canyon and all four of the survey areas is well above Arnold’s (1985) cutoff for local procurement of clay resources.
¶ 65 One additional problem to be noted regarding the identification of production area(s) of Mesa Verde White Ware lies in the differentiation of the carbon-painted types of this ware from other types of carbon-painted white ware, especially Chaco-McElmo Black-on-white. While some researchers working within the San Juan Basin have tended to lump all carbon-painted (and presumably non-trachyte-tempered) ceramics together as Mesa Verde White Ware, more recently there has been a recognition that many of these sherds, particularly those with McElmo style designs, have Cibola White Ware pastes (Toll et al. 1980). Thus, the presence of carbon paint alone cannot be used to differentiate Mesa Verde White Ware from other types. The practice during the present project was to rely on paste, paint, and design characteristics (see Appendix 4.2 for more complete descriptions of the taxonomic criteria), but this practice is not a universal one, and care should be taken when comparing the counts of this report with others where the means of differentiation may be more broad.
¶ 66 The other wares recorded during the inventory survey occur in low frequencies and/or at greater distances than the wares discussed above. While some studies have been conducted on the remaining wares using sherd samples from the San Juan Basin (e.g., Windes 1977), most inferences of areas of production are more general, and are based on the imperfect principle of greatest ubiquity. San Juan Red Ware is generally inferred to have been manufactured to the north, in the northern drainages of the San Juan River. Tusayan White Ware and Tsegi Orange Ware both occur in their greatest frequencies in northeast Arizona, and southeast Utah. White Mountain Red Ware may have been produced as close as 80 km or as far away as 250 km or more to the south and southwest.
¶ 67 As the above discussion indicates, for most wares, the specific locations of production of the various wares cannot be identified. General zones of production are, however, indicated. A zonal approach is necessary because of the geological and geomorphological processes responsible for the distributions of raw materials. Of all the wares found in the Chaco area, only the production areas of Chuskan wares may be narrowed down with any certitude. For this reason, and because Chuskan ceramics are the most abundant nonlocal wares occurring within the project areas, they will be analyzed in greater detail with respect to distribution from their area of production.
Ceramic Wares and Vessel Form
¶ 68 An important aspect of the analysis of ceramic production is vessel function. Vessel form is generally a good indicator of vessel function, and the production of certain wares for specific purposes may be examined by looking at the frequencies of different vessel forms within and between wares. As Arnold (1985:236) notes, the demonstration of relationships between paste composition and vessel form may help give an indication of the “...relative economic dominance of a pottery making community in an area.” Ethnographic data indicate that exchange of goods produced within a specific area is often according to specific shape classes (Arnold 1985; Fry 1980; Reina and Hill 1978). Previous ceramic analyses in the central Chaco Canyon have suggested that relationships of form and paste composition are present (Toll 1981, 1984), but the extent to which these patterns are true throughout the San Juan Basin has not been investigated.
¶ 69 During the present project, vessel form was recorded as one of two values: bowl or jar. Although gross, these two formal categories provide a method for looking at variability in vessel forms, both between and within wares. There are two major areas of interest in such an investigation. First, for those wares that are inferred to have been locally made, the question may be asked, to what extent is there functional specificity within each ware. A second question of interest is whether the nonlocal wares being brought into the project areas are representative of the formal variability within their respective areas of production, or alternatively, whether there is some kind of selection process being introduced for one vessel form over another.
¶ 70 As mentioned during the discussion of the recording methods, all Cibola and Chuska Gray Ware sherds were coded as jars, an assumption generally supported by the rim sherds recorded during the present project and by the very low frequencies (generally less than 1 percent) of excavated plainware bowls. A total of 58 percent of the total ceramics are Cibola Gray Ware jars, indicating that this ware not only has a great deal of functional specificity, but also that it must have played an important role in the ceramic assemblages of the project areas.
¶ 71 Chuska Gray Ware was the most prevalently recorded nonlocal ware, accounting for 60 percent of all nonlocal ceramics, and over 6 percent of all ceramics. That the predominant nonlocal ware should be brought into the project areas in the form of jars is interesting, but coupled with the fact that these are plainware jars makes their presence even more intriguing. Nearly fifty years ago, Anna Shepard noted the significance of large numbers of indented corrugated Chuska Gray Ware jars in Chacoan assemblages, pointing out that this is contrary to what most archaeologists would assume:
Such a theory, assuming a large volume of trade in culinary ware, is contrary to accepted ideas, but it seems less improbable when we consider that the making of indented corrugated pottery required a very high degree of skill, and consequently there may well have existed centers where potters specialized in the technique (1939:281).
¶ 72 Why should such a large number of trachyte-tempered plainware jars be brought into the Chacoan area? Windes (1977) has suggested that trachyte provides greater durability than other available tempering materials. Investigating this idea through a mechanical test of wall sheer strength, he found the results to be negative. Because the vessels were probably used for cooking vessels, a mechanical test of wall strength may not have been the most appropriate test. The idea that vessels made with trachyte produce stronger cooking pots should be further investigated with tests that more directly monitor the ability of the vessel to withstand “thermal shock,” or repeated temperature cycling.
¶ 73 Among the decorated wares found within the project areas, there are important differences in the frequencies of bowls and jars. Because sherd frequencies are being used without control for sherd or vessel size, and jars tend to be larger than bowls, it might be expected that all things being equal, the number of jar sherds should be greater.
¶ 74 Considering first the dominant local decorated ware, Cibola White Ware, jars are nearly twice as frequent as bowls (Table 4.20). This trend is not true, however, for all styles of Cibola White Ware. Basketmaker III-Pueblo I mineral-on-white is the reverse of the pattern for the combined total of Cibola White Ware. This stylistic/temporal category is composed of nearly 70 percent bowls. In part, the larger number of bowls may be due to difficulties in the recognition of this type among undecorated body sherds of jars. Designs on jars of this early Cibola White Ware type often do not cover the entire vessel. Because the amount of decoration generally increases through time among the Cibola White Ware styles, it might be expected that the number of jars recognized would also increase through the typological sequence. As Table 4.20 shows, this is generally true; types which are later than the Basketmaker III-Pueblo I style are predominantly jars, with one exception, Chaco-McElmo Black-on-white. This exception is particularly interesting for two reasons. First, Chaco-McElmo is the only Cibola White Ware type that is carbon painted. Second, relative to the other Cibola White Ware types, this type has the most restricted temporal range (approximately A.D. 1100 to 1175), and its production has considerable temporal overlap with at least one other Cibola White Ware style, Chaco Black-on-white. At least in terms of vessel form, the production of Chaco-McElmo Black-on-white may have been of a specialized nature. Its relatively short production span and unique paint type also suggest unusual production circumstances.
Table 4.20. Vessel form frequencies for Cibola White Ware types.
¶ 75 By contrast to the presumed locally produced Cibola White Ware, nonlocal Chuska White Ware recorded within the survey areas has a lower overall frequency of jar forms (Table 4.21). Jars and bowls are about equally represented if the total frequencies for all types within the ware are considered. As with the Cibola White Ware, however, there is some intra-ware variability. The roughly contemporaneous styles designated “BMIII-PI mineral-on-white” and “BMIII-PI carbon-on-white” have contrasting vessel form frequencies, but their small sample sizes make this trend difficult to evaluate.
Table 4.21. Vessel form frequencies for Chuska White Ware types.
¶ 76 Other than Basketmaker III-Pueblo I carbon-on-white, all Chuskan styles within the project samples dating before approximately A.D. 1000 are represented by less than 50 percent bowls. From Chuska Black-on-white on, bowls are clearly dominant. This form is easier to transport, and might be expected to dominate among trade wares, an expectation which makes the large number of jars of Chuska Gray Ware especially significant. The large number of jars present within the two unidentifiable categories of “Chuska carbon-on-white” and “unidentified Chuska White Ware” is probably due to difficulties in making specific stylistic assignments to many jar sherds with little or no painted decoration.
¶ 77 Windes (1977) reports vessel form proportions of each of the Chuska White Ware types recorded within the CGP survey area, along the lower Chaco River, northwest of Chaco Canyon. Although, as discussed above, Chuskan wares were probably not produced within the CGP area, this area is much closer to the probable area of manufacture than the current project areas. The CGP area contains a large proportion of Chuskan ceramics and provides an interesting data set with which to compare the vessel form proportions of Chuska White Ware occurring within the present project’s survey areas. The bowl and jar percentages for each Chuska White Ware carbon-painted type discussed by Windes is shown in Table 4.21. Of the typological categories that are comparable to those recorded during the present project, the proportions of individual vessel forms with each type generally parallel those from the CGP area, although there are some interesting differences. The closest ratios of bowls to jars are at the latter end of the temporal sequence, for the two types of Toadlena and Crumbled House Black-on-whites. In both of these cases, the percentages of bowls within the CGP versus the present project areas are within 5 percent of each other. Percentages of bowls and jars for earlier types tend to fluctuate more. In terms of the entire assemblage, there is a slightly higher proportion of bowls versus jars in the CGP sample (approximately 1.5:1) compared with the present project (approximately 1:1).
¶ 78 Mesa Verde White Ware sherds are more frequent than those of Chuska White Ware in the survey sample. The percentage of bowls of Mesa Verde White Ware is greater than either the Cibola or Chuska White Ware totals. In fact, the proportions of bowls and jars of Mesa Verde White Ware, at about 2:1 (Table 4.22) is almost the reverse of the Cibola White Ware ratio of about 1:2 (Table 4.20). While the predominance of bowls among the Mesa Verde White Ware types is consistent, it is interesting that the trend again appears to increase through time. The latest typological style, Mesa Verde Black-on-white, has the largest proportion of bowls. Assuming that this type of Mesa Verde White Ware is nonlocal, bowls were apparently the predominant form being imported from the northern Anasazi area during the thirteenth century.
|
Table 4.22. Vessel form frequencies for Mesa Verde White Ware types.a |
|||||||||
|---|---|---|---|---|---|---|---|---|---|
| Ceramic Type | Present Project | Mug Houseb | |||||||
| Bowls | Jars | Other | Total | Bowls | Jars | Other | Total | ||
| *Mancos/Cortez B/W | No. | 99 | 54 | 8 | 161 | 521 | 472 | 33 | 1,026 |
| Row % | 61.49 | 33.54 | 4.97 | 100.0 | 50.78 | 46.00 | 3.22 | 100.0 | |
| Col. % | 13.06 | 18.49 | 21.62 | 14.81 | - | - | - | - | |
| *McElmo B/W | No. | 320 | 145 | 18 | 483 | 683 | 175 | 67 | 925 |
| Row % | 66.25 | 30.02 | 3.73 | 100.0 | 73.84 | 18.92 | 7.24 | 100.0 | |
| Col. % | 42.22 | 49.66 | 48.65 | 44.43 | - | - | - | - | |
| *Mesa Verde B/W | No. | 172 | 16 | 0 | 188 | 3093 | 481 | 172 | 3,746 |
| Row % | 91.49 | 8.51 | - | 100.0 | 82.57 | 12.84 | 4.59 | 100.0 | |
| Col. % | 22.69 | 5.48 | - | 17.30 | - | - | - | - | |
| Uniden. Mesa Verde C/W | No. | 167 | 77 | 11 | 255 | - | - | - | - |
| Row % | 65.49 | 30.20 | 4.31 | 100.0 | - | - | - | - | |
| Col. % | 22.03 | 26.37 | 29.73 | 23.46 | - | - | - | - | |
| TOTAL | No. | 758 | 292 | 37 | 1,087 | 4,297 | 1,128 | 272 | 5,697 |
| Row % | 69.73 | 26.86 | 3.40 | 100.0 | 75.43 | 19.80 | 4.77 | 100.0 | |
| Col. % | 100.0 | 100.0 | 100.0 | 100.0 | |||||
| aChi-square calculated on bowls versus jars of
identified (starred*) types only=42.355, df=2, prob=0.0001,
and Cramer’s V=0.229. bData from Rohn (1971:Tables 21 and 24), for sherd samples from Mug House, Mesa Verde National Park. “Other” here was calculated as ladle and mug frequencies. All closed forms grouped together into jars. |
|||||||||
¶ 79 Using the proportions of bowls to jars of Mesa Verde White Ware from Mug House (Rohn 1971), vessel form proportions from the survey areas may be compared with the proportions of sherds from a location within the general area of production of this ware (Table 4.22). Because Mancos and Cortez Black-on-whites were rarely recorded during the present project, totals for Mancos, Cortez, and Mancos-Cortez were combined to provide larger sample sizes and to make them comparable to Rohn’s data. This combination results in a proportion of bowls of 61 percent, approximately 10 percent greater than the proportion of Cortez and Mancos Black-on-white bowls at Mug House. In the case of McElmo Black-on-white, the proportion of bowls occurring in the present project areas is 8 percent less than the proportion of bowls from Mug House, although in both cases bowls are predominant. A greater proportion of bowls of Mesa Verde Black-on-white was recorded within the survey areas versus the Mug House sample, although again both are dominated by bowls. Thus, the increasing tendency through time for higher proportions of bowls of Mesa Verde White Ware is true for both the Chaco Additions assemblages and the Mesa Verde area assemblages, although the proportions themselves are not the same. By the time Mesa Verde Black-on-white was being made, over 90 percent of the vessels of Mesa Verde White Ware being brought into the present project areas were bowls. Comparisons of the total frequencies indicate that the proportions of bowls versus jars are higher within the Mug House sample (approximately 3.75:1) compared with that of the present survey areas (approximately 2.5:1). Thus, overall, proportionately more jars than bowls were brought into the survey areas than might be expected given the proportions within their general area of production, although as noted above this is more pronounced for the earlier types than for Mesa Verde Black-on-white itself.
¶ 80 Sherds of Tusayan White Ware were rare within the survey areas. The overall proportion of bowls to jars within this ware is most similar to that of Chuska White Ware—approximately 1:1 (Table 4.23). One type that initially stands out is Kana'a Black-on-white, the only Tusayan White Ware type apparently brought into the project areas in predominantly jar forms. But, of the 53 Kana'a Black-on-white jar sherds, 43 are from a single provenience, and are probably from the same vessel. The remaining jar sherds and the bowl sherds of this type are from 11 different proveniences. Thus, with the sherds from the probable Kana'a pot drop eliminated, the ratio of bowls to jars for this type would be approximately 1:1.
|
Table 4.23. Vessel form frequencies for Tusayan White Ware types.a |
|||||||
|---|---|---|---|---|---|---|---|
| Ceramic Type | Present Project | Pinyon Projectb | |||||
| Bowls | Jars | Other | Total | Bowl:Jar | Total | ||
| *BMIII-PI C/W | No. | 30 | 21 | 1 | 52 | ||
| Row % | 57.69 | 40.38 | 1.92 | 100.0 | |||
| Col. % | 18.40 | 14.48 | 33.33 | 16.72 | |||
| *Lino B/G | No. | 45 | 30 | 0 | 75 | 2:1 | 14 |
| Row % | 60.00 | 40.00 | - | 100.0 | |||
| Col. % | 27.61 | 20.69 | - | 24.12 | |||
| *Kana’a B/W | No. | 10 | 53 | 0 | 63 | B>J | 142 |
| Row % | 15.87 | 84.13 | - | 100.0 | |||
| Col. % | 6.13 | 36.55 | - | 20.26 | |||
| *Black Mesa & Sosi B/W | No. | 73 | 25 | 2 | 100 | Black Mesa B/W B>J | 37 |
| Sosi B/W 1:1 | 33 | ||||||
| Row % | 73.00 | 25.00 | 2.00 | 100.0 | |||
| Col. % | 44.78 | 17.24 | 66.67 | 32.15 | |||
| Uniden. Tusayan WW | No. | 5 | 16 | 0 | 21 | ||
| Row % | 23.81 | 76.19 | - | 100.0 | |||
| Col. % | 3.07 | 11.03 | - | 6.75 | |||
| TOTAL | No. | 163 | 145 | 3 | 311 | ||
| Row % | 52.41 | 46.62 | 0.96 | 100.0 | |||
| Col. % | 100.0 | 100.0 | 100.0 | 100.0 | |||
| aChi-square calculated on bowls versus jars of
identified (starred*) types only=55.080, df=3, prob=0.0001,
and Cramer’s V=0.438. bData from Pepoy and Linford (1982). Only bowl/jar ratios are presented in report. |
|||||||
¶ 81 Comparison of the overall vessel form frequencies of Tusayan White Ware occurring within the survey areas with areas lying within the area of production of this ware indicate that the forms coming into the central San Juan Basin are different from the proportions occurring in their areas of production. Lerner’s (1984) sample of Tusayan White Ware rim sherds from the 1977 Black Mesa excavations indicates that bowls were present in much larger quantities than jars, in a ratio of approximately 4:1. This is a much higher ratio of bowls to jars than for the combined totals of Tusayan White Ware within the present project areas, at 1:1.
¶ 82 Comparisons by individual Tusayan White Ware ceramic types from the Black Mesa area with the survey samples also indicates slightly different representation of vessel forms. In the samples reported by Pepoy and Linford (1982), Dogoszhi Black-on-white was the only Tusayan White Ware type which was produced in predominantly jar forms. This type was not identified within any of the four present survey areas, and none of the other types within the present survey project areas—except the problematical Kana'a Black-on-white—were produced in predominantly jar forms. Kana'a Black-on-white from the Black Mesa area appears to have been produced in slightly greater quantities of bowls, as was Black Mesa Black-on-white. Sosi and Tusayan Black-on-whites were produced in roughly equal proportions of bowls and jars, with only Flagstaff Black-on-white showing a dramatic preference for production as bowls (estimated ratio of approximately 30:1). Neither Flagstaff nor Tusayan Black-on-whites were identified during the present project, but the combined category of Black Mesa/Sosi Black-on white (Table 4.23) indicates a ratio of bowls to jars at about 3:1, a greater ratio than might be expected given the tabulations presented by Pepoy and Linford (1982) for the Black Mesa area. Windes (personal communication, 1986) notes that the late Tusayan White Ware (i.e., Black Mesa and Sosi Black-on-whites) in Chaco Canyon excavation and survey assemblages are also usually represented by bowl forms.
¶ 83 All types of White Mountain Red Ware were predominantly bowls. Less than 10 percent of the total of this ware were jars (Table 4.24). White Mountain Red Ware was predominantly made in bowl forms in its primary area of production. The frequencies of pooled White Mountain Red Ware types from an excavation project just north of the Zuni Reservation (Robertson et al. 1983), indicate that bowl forms were represented by 90 percent of the total ceramics, and never made up less than 70 percent of sherds of any single White Mountain Red Ware type (Table 4.24). Thus, the high occurrence of bowls within the survey areas is nearly identical to the proportion of this form in an area close to if not within the area of production of this ware. The very high proportion of bowls suggests greater functional specialization of this ware than any other decorated ware occurring with the project areas, with the possible exception of Tsegi Orange Ware (discussed below).
Table 4.24. Vessel form frequencies for White Mountain Red Ware types.
¶ 84 Other wares were recorded less frequently than those discussed above, but also show preferences for production in one form over another (Table 4.25). San Juan Red Ware has an approximate ratio of bowls to jars of about 2:1. Over 96 percent of the sherds of Tsegi Orange Ware were bowls. All types of San Juan Red Ware, grouped here for the sake of sample size, predate A.D. 1000. All types of Tsegi Orange Ware, on the other hand, post-date A.D. 1000. Again, the trend toward decreasing frequencies of nonlocal jar sherds through time is present. Chuska Orange Ware was also present in high bowl frequencies, although the total number of sherds of this ware was the lowest of all wares identified during the project.
|
Table 4.25. Vessel form frequencies for San Juan Red Ware, Tsegi Orange Ware, and Chuska Orange Ware. |
|||||
|---|---|---|---|---|---|
| Ware | Bowls | Jars | Other | Total | |
| San Juan Red Ware | No. | 184 | 75 | 5 | 264 |
| % | 69.70 | 28.41 | 1.89 | 100.0 | |
| Tsegi Orange Ware | No. | 76 | 3 | 0 | 79 |
| % | 96.20 | 3.80 | - | 100.0 | |
| Chuska Orange Ware | No. | 22 | 4 | 0 | 26 |
| % | 84.62 | 15.38 | - | 100.0 | |
¶ 85 Table 4.26 summarizes the distribution of vessel forms by local (Cibola White Ware and Gray Ware) and nonlocal (all other prehistoric wares) ceramics. As this table indicates, the ratio of bowls to jars of local manufacture at approximately 1:7 is considerably different from those of nonlocal manufacture at approximately 1:3. Thus, a greater proportion of nonlocal ceramics are being brought into the project areas as bowls than might be expected.
|
Table 4.26. Vessel form frequencies for local versus nonlocal prehistoric ceramics.a |
|||||
|---|---|---|---|---|---|
| Local | Nonlocal | ||||
| Vessel Form | No. | % | No. | % | Total |
| Bowls | 7,912 | 12.05 | 2,140 | 26.71 | 10,052 |
| Jars | 57,374 | 87.40 | 5,807 | 72.47 | 63,181 |
| Other | 358 | 0.55 | 66 | 0.82 | 424 |
| Total | 65,644 | - | 8,013 | - | 73,657 |
| aChi-square calculated on bowls versus jars only=1312.100, df=1, prob=0.0001, Cramer’s V=0.134. | |||||
¶ 86 In summary, it appears that the presumed locally made Cibola White Ware was produced in both bowl and jar forms, with the proportion of the latter increasing through time. Nonlocal painted wares show an inverse pattern; bowls tend to predominate, and there is a trend toward increasing frequencies of bowls through time. By A.D. 1000, most of the nonlocal painted types were being brought into the project area in bowl form. Of the nonlocal wares, Chuska Gray Ware and White Ware show the highest proportions of jars. By contrast, the two wares with the highest proportions of bowls are White Mountain Red Ware and Tsegi Orange Ware. Interestingly, the Chuskan wares were probably produced closer to the survey areas than any other wares, and the White Mountain Red Ware and Tsegi Orange Ware were probably produced the furthest away. This suggests that for long distance transport, bowl forms are preferred, while jar forms may be more commonly traded over relatively shorter distances. The reasons for this, however, are not suggested by the data. Possible factors include: 1) bowls are smaller than jars and therefore lighter for easier long-distance transport; 2) bowls can be intentionally constructed for nestability (Whittlesey 1974), and more vessels therefore may be carried in the same amount of space; and 3) it may have been the contents of the Chuskan jars rather than, or in addition to, the vessels themselves which were of importance in the transport of ceramics into the project areas.
Patterns of Distribution
Temporal Patterns in Ceramic Ware Proportions
¶ 87 Temporal patterns of distribution of the ceramic wares may be compared by looking at their changing proportions through the five date groups (Table 4.27). Cibola Gray Ware, the most prevalent ware through all time periods, reaches its maximum percentage during the first date group of A.D. 550 to 750. The percentage of this ware decreases through each successive date group, but never drops below 45 percent of the total ceramics within any single date group.
Table 4.27. Distribution of ceramic wares by date group and survey area.
¶ 88 Cibola White Ware is the second most prevalent ware within any date group. But unlike Cibola Gray Ware, its date group percentages rise until approximately A.D. 890 to 1025, after which it evens out and then drops slightly. Temporal patterning of Cibola White Ware is very close to being the opposite of Cibola Gray Ware (see Figure 4.4), because, with few exceptions, the percentages of all other wares are relatively low.
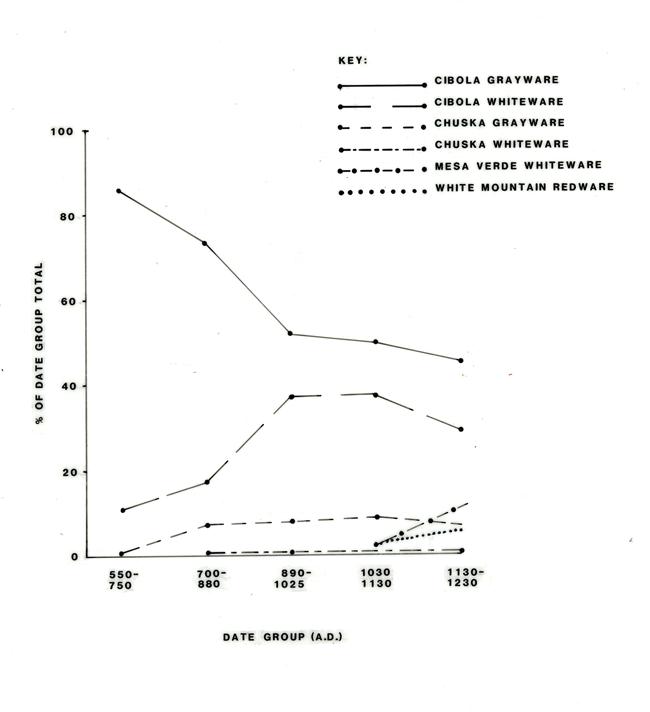 |
Figure 4.4. Temporal distribution of ceramic wares. |
¶ 89 Of all the remaining wares, Chuska Gray Ware is the third most prevalent ware in all but the last date group. While relatively rare during the first date group (A.D. 550 to 750), it has relatively constant percentages of from 7 percent to 9 percent during all succeeding date groups. Chuska White Ware, virtually absent from the earliest date group, also has relatively constant percentages throughout the remaining temporal sequence, but its range is only between 0.10 percent and 1.34 percent. Its absence from the earliest time period is not surprising, because this ware was apparently not produced prior to about A.D. 700 (Windes 1977), or even A.D. 800 (Peckham 1977; Warren 1967).
¶ 90 Of the remaining wares, only Mesa Verde White Ware and White Mountain Red Ware have percentages exceeding 1 percent of any particular date group total. The former ware is less than 0.15 percent until A.D. 1030 to 1130, when it reaches 1.5 percent. Its highest percentage (10.7 percent) is reached during the last date group of A.D. 1130 to 1230. This last date group is also the time period of the maximum percentage of White Mountain Red Ware (4.75 percent).
Ware Distributions by Survey Area and Date Group
¶ 91 Trends through time in the proportions of local (Cibola Gray Ware and White Ware) and nonlocal (all other) ceramics by survey area are summarized by Figure 4.5. During the earliest time period (A.D. 550 to 750), the two outlier communities are contrastive as a pair with the other two survey areas in that the former have higher proportions of nonlocal ceramics. During the next time period, nonlocal ceramics at all four areas increase, but the jump in nonlocals at the South Addition is most substantial. In fact, during this period, the proportion of nonlocal ceramics is greater within this area than at Kin Bineola. Between A.D. 890 and 1025, the two outliers again have the highest proportions of nonlocal ceramics, but the spread among the four areas is the smallest of any date group. Chacra Mesa shows a steady increase in the proportion of nonlocal ceramics, a trend which increases during the next period of A.D. 1030 to 1130. During this period, the Chacra Mesa area exceeds Kin Bineola in the proportion of nonlocal ceramics, and is most similar to Kin Klizhin in the pattern of increase.
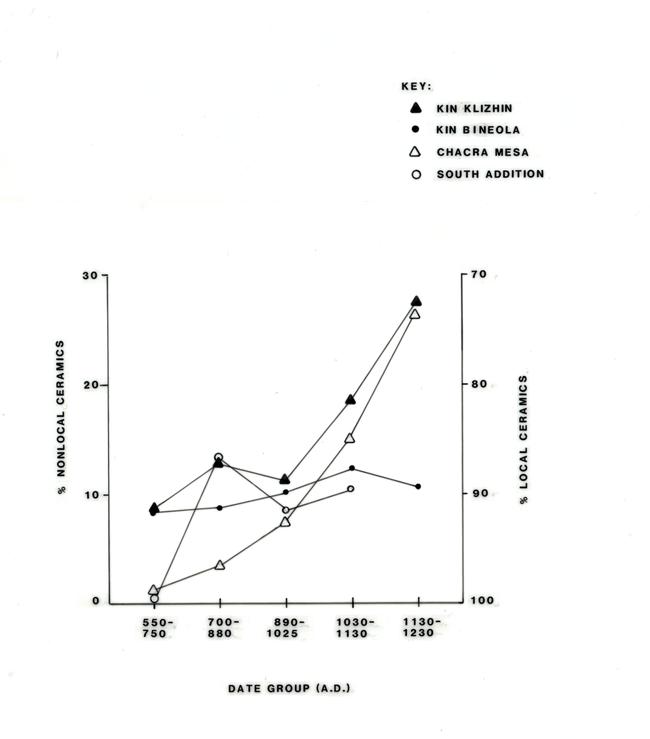 |
Figure 4.5. Percentage of nonlocal ceramics by date group and area as a percentage of total ceramics. |
¶ 92 The Kin Klizhin and Chacra Mesa areas again parallel each other during the following period of A.D. 1130 to 1230. The proportions of nonlocals at these two areas are the highest for the period, as well as the highest of any period, at 26-27 percent. During no other period does the proportion of nonlocal ceramics exceed 20 percent. The Kin Bineola area, interestingly, shows no dramatic increases in nonlocal ceramics from one time period to another. By contrast to all other areas, it maintains relatively steady proportions of nonlocal ceramics ranging from 8 percent to 12 percent.
¶ 93 The stability in the proportions of local versus nonlocal wares at the largest outlier community of Kin Bineola is an intriguing pattern. Based simply on size alone, it might be expected that this outlier community would have more nonlocal ceramics represented. Given that Kin Bineola and Kin Klizhin are virtually the same distance to the Chuskas, the source for most of the nonlocal ceramics coming into the survey areas, it might be expected that the proportions of local versus nonlocal ceramics at the two areas would be roughly equal. The strong pattern to the contrary suggests that other factors besides absolute distance are at work. Kin Klizhin is slightly closer to Chaco Canyon itself, and this may be of some significance. Also of potential importance is the relative distance of the two outliers to the Chaco Wash. Marshall (personal communication, 1985) has suggested that the Chaco Wash was a major corridor of travel and trade between the central Canyon and the Chuska area, based on the relatively higher proportions of Chuskan wares at sites located along the wash versus those in side drainages. The direction of roads leaving Peñasco Blanco also go through the Chaco Wash (Windes, personal communication, 1986), lending more support toward the use of this wash as a major travel corridor. Kin Bineola and Kin Klizhin fit this pattern. Kin Klizhin is closer to the Wash, and does have the higher proportion of nonlocals (particularly Chuskan wares). Thus, this outlier may have had greater participation in the transport of goods from the Chuska area to the central canyon.
¶ 94 Because specific ceramic wares are often correlated with vessel form, it is reasonable to suggest that the distribution of these wares may have been via different processes. Plainware demand and supply may have been quite different from that of painted wares. The discussion above treated all nonlocal ceramics as a percentage of the total ceramic sample within a particular area and date group. Treating each of the major ceramic fabric groups separately—plainware and painted ware—shows that there may be additional variability underlying the distribution of nonlocal wares.
¶ 95 Only two types of plainware were identified on the present survey. The percentage of nonlocal Chuska Gray Ware in plainware assemblages within a given area and date group is therefore inversely proportional to the percentage of local Cibola Gray Ware. The temporal and spatial distribution of local versus nonlocal plainwares (Figure 4.6) show some interesting contrasts with the distribution of all nonlocal ceramics (Figure 4.5). Unlike the plot of all nonlocal ceramics, all areas except the South Addition show very similar trends through time. Kin Klizhin, Kin Bineola, and Chacra Mesa all show steady increases in the percentages of nonlocal (Chuskan) plainware within plainware assemblages, peaking during the A.D. 1030 to 1130 date group. The South Addition has its peak during the preceding period of A.D. 890 to 1025. Similar to the previous plot, Kin Klizhin has the highest percentages of nonlocal plainwares throughout most of the sequence. By contrast to the previous plot, the Kin Bineola and Chacra Mesa survey areas are more similar.
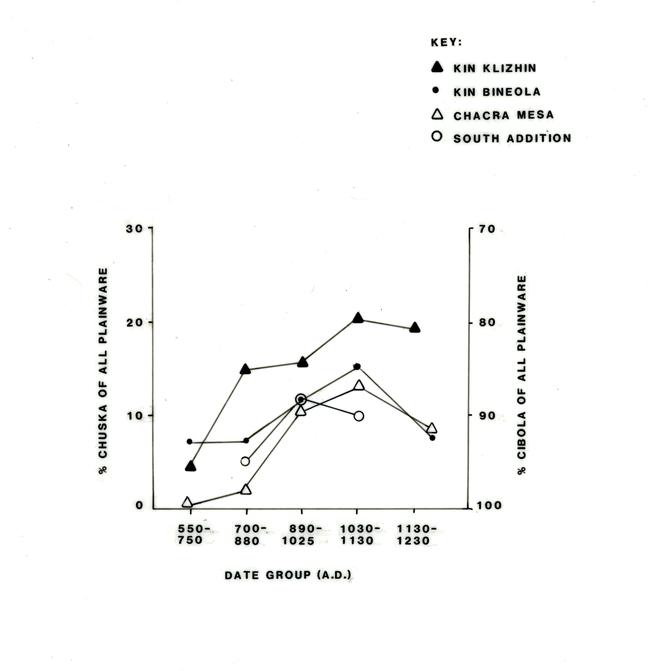 |
Figure 4.6. Percentage of Chuska Gray Ware and Cibola Gray Ware as a proportion of total gray ware by date group and survey area. |
¶ 96 The similarities in the pattern of increase and decrease of Chuska Gray Ware among the four areas suggests that the mode of distribution of this ware was similar. The distribution of nonlocal painted wares does not follow the same pattern as that of the plainwares (Figure 4.7). Instead of a steady increase, there is a bimodal distribution in the relative frequencies of nonlocal painted wares, with peaks at the beginning and end of the prehistoric ceramic sequence.
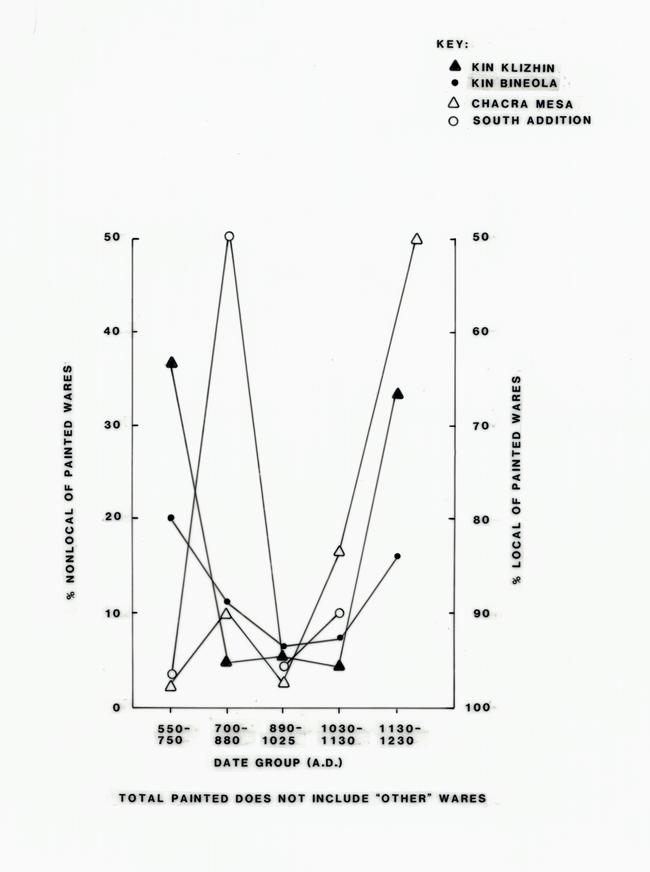 |
Figure 4.7. Percentage of nonlocal painted wares as a proportion of total painted wares by date group and survey. |
¶ 97 The two outlier communities (Kin Klizhin and Kin Bineola) have the highest percentages of nonlocal painted wares during the earliest period of A.D. 550 to 750. Tusayan White Ware is the most common nonlocal painted ware during this period. The subsequent two periods see a marked decrease in the percentage of nonlocal painted wares within all areas except for the South Addition, which has an extreme proportion (over 50 percent) of nonlocal painted wares during the period of A.D. 700 to 880, mostly Chuska White Ware. The lowest percentages of nonlocal painted wares (and hence, the highest percentages of local, Cibola White Ware) occur during the period of A.D. 890 to 1025. The next two date groups see a rise in the percentages of these wares, but not uniformly. The Kin Klizhin and Chacra Mesa areas have the highest percentages during the A.D 1130-1230 period, echoing the pattern shown in Figure 4.5. This rise in the percentage of nonlocal painted wares in the last two periods is primarily in the proportion of Mesa Verde White Ware.
¶ 98 The contribution of Chuska White Ware alone to the nonlocal painted ware totals is illustrated in Figure 4.8. This plot clearly shows that the high values for the South Addition between A.D. 700 and 880 are nearly all based on the presence of Chuska White Ware. In addition, the contrast between the distribution of Chuska White Ware and Chuska Gray Ware plots (Figures 4.8 and 4.6, respectively) indicate that the economics of exchange of these two wares were probably different, a conclusion also reached by Toll (1985). The distribution of Chuska White Ware never reached the same proportions as that of Chuska Gray Ware, despite their presumed location of production in the same area.
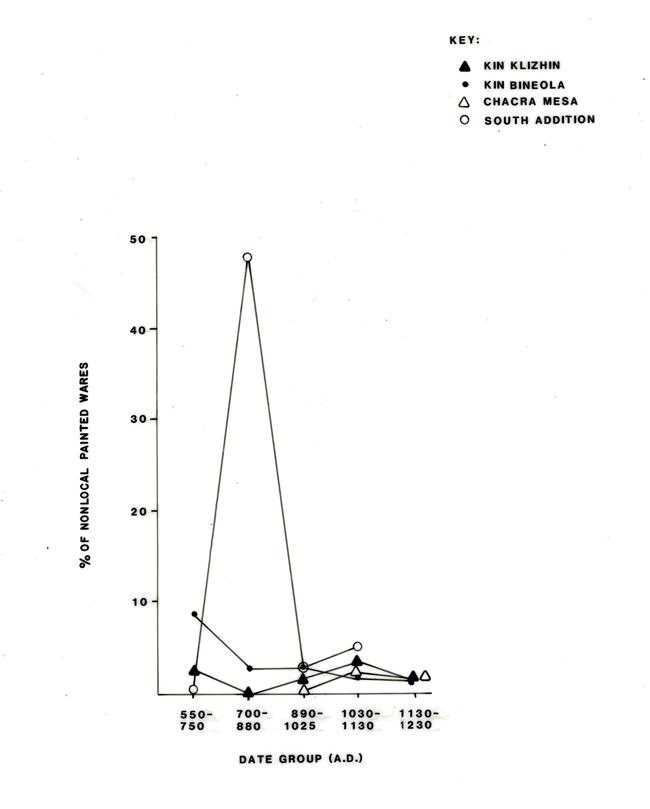 |
Figure 4.8. Percentage of Chuska White Ware as a proportion of total nonlocal painted wares by date group and survey area. |
Ware Distribution by Site Type Group
¶ 99 The distribution of local and nonlocal ceramic wares within and between the four survey areas by site type groups is also important to look at because of suggestions in the literature that: 1) the large Chacoan structures or great houses (“towns”) were occupied by different social groups than smaller structures (“villages”) in the same areas (Vivian 1970), or 2) that great houses and great kivas may have served as redistributive structures within the communities of which they were part (Judge 1979). We may also look at the frequency with which nonlocal ceramics were being taken to nonstructural sites, which were presumably not used for habitation. If nonlocal ceramics were valued products, then it might be expected that they would be used less frequently at nonhabitation sites and would not be recorded archeologically at these sites.
¶ 100 Table 4.28 shows the percentages of plain and painted, local and nonlocal ceramics by area and site type groups. Here, all nonstructural site types have been grouped together. The table shows that the site type group of Chacoan structures/great kivas generally has higher percentages of nonlocal wares, ranging from 11.80 percent of the total sample in the Kin Bineola area to 20.16 percent of the total sample in the Kin Klizhin area. The South Addition does not have any sites classified as Chacoan structures or great kivas.
Table 4.28. Distribution of local and nonlocal wares by site type group and survey area.
¶ 101 Using the percentages of the total sample within each area, differences between the proportion of nonlocal ceramics at Chacoan structure/great kiva sites and large structures may be compared. Differences between these two site type groups are present within the two areas of Kin Klizhin and Chacra Mesa, but not within the Kin Bineola area. In the latter area, the proportions are roughly similar, in the 10-12 percent range. Kin Bineola Chacoan structure/great kiva sites have only slightly higher proportions of nonlocal ceramics. Interestingly, it is nonlocal plainwares, not painted wares, which are more prevalent at the Chacoan structure/great kiva sites of the two outlier communities, while painted nonlocal wares are more prevalent at the Chacoan structure/great kiva site recorded within the Chacra Mesa area. Although overall sample sizes are generally small for the site type group of Chacoan structures/great kivas in each area, these data do not suggest that the residents of sites classified as Chacoan structures/great kivas had greater access to nonlocal ceramics than those living in large structures within their respective areas.
¶ 102 Using the proportion of nonlocal grayware and nonlocal painted ware in the sample of all grayware and all painted ware respectively, the contrasts between Chacoan structures/great kivas and other site type groups are still small (Figures 4.9a and b). Chacoan structures/great kivas in the Kin Klizhin area have the highest percentage of Chuska Gray Ware and the greatest difference in percentages compared to other site type groups within its area. Chacoan structures/great kivas in the Chacra Mesa area have the largest difference in percentages of nonlocal painted ware. Contrary to the expectations of the Chacoan structure/small house dichotomy, the Chacoan structures/great kivas in the Kin Bineola area have slightly lower percentages of nonlocal painted wares.
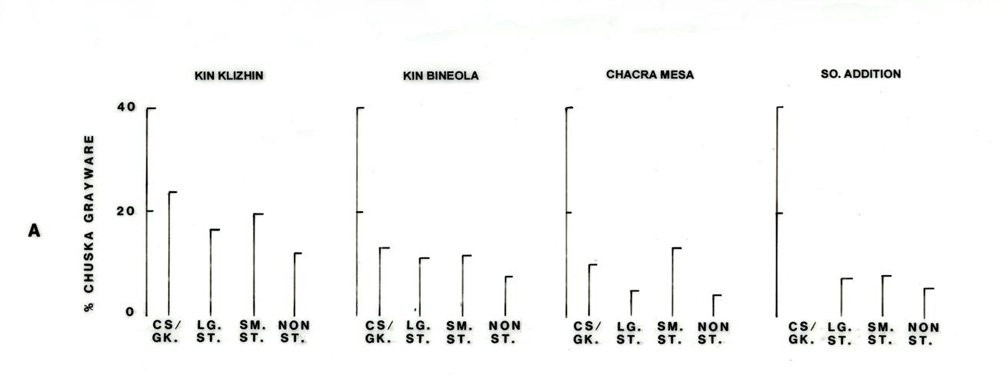 |
Figure 4.9a. Bar graph of percentage of Chuska Gray Ware in plain ware assemblages by area and site type group. |
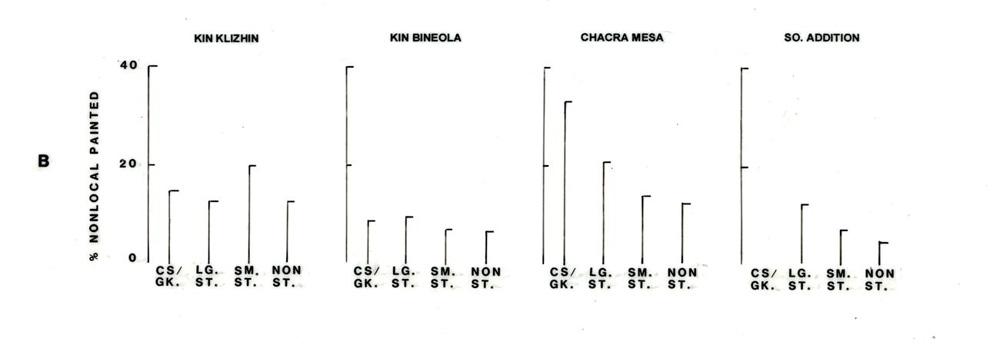 |
Figure 4.9b. Bar graph of percentage of nonlocal painted ware in painted assemblages by area and site type group. |
¶ 103 If the site type group of Chacoan structures/great kivas is broken down into individual sites, however, the two largest great houses, Kin Bineola (29SJ 1580) and Kin Klizhin (29SJ 1413), have the two highest proportions of nonlocal ceramics at 18.46 percent and 20.16 percent respectively. The Kin Bineola site has the highest percentage of trachyte-tempered ceramics, but other Chacoan structures and great kivas within the same community do not have the same high proportions. Three other sites within the Kin Bineola area besides Kin Bineola itself have Chacoan structures/great kivas. The Chacoan structure designated 29Mc 291 has 14.35 percent nonlocal ceramics in its assemblage, but 29Mc 261, a great kiva/habitation site has only 6.16 percent. Site 29SJ 2531, a trash mound near the Kin Bineola structure and recorded as a Chacoan structure, has the lowest proportion of nonlocal ceramics of any of the sites falling into the site type group (4.65 percent). The Chacra Mesa Chacoan structure (29SJ 2384) has a lower proportion of nonlocal ceramics (12.76 percent) than does the isolated great kiva (29SJ 2557) falling within the same area (22.07 percent). Thus, within the general site type group of Chacoan structures/great kivas, Chacoan structures do not consistently have higher proportions of nonlocal ceramics than do great kivas. But, as this analysis indicates, the Kin Bineola site has a higher proportion of nonlocal ceramics than all of the other Chacoan structures or great kivas sampled within the entire Kin Bineola community.
¶ 104 The site type group of small structures, those with two rooms or less, is not clearly differentiated from the large structures in terms of their proportions of local versus nonlocal wares. At the two areas of Kin Klizhin and Chacra Mesa, the proportion of nonlocal wares at small structures exceeds that of large structures. But at Kin Bineola and the South Addition, the proportion of nonlocal wares is roughly the same between the two site type groups. The range of nonlocal wares at the site type group of small structures ranges from a low of 7.50 percent at the South Addition to 19.79 percent at Kin Klizhin.
¶ 105 Nonstructural sites consistently have the lowest percentages of nonlocal ceramics in all four areas. Furthermore, in every area except Chacra Mesa, nonlocal plainware (i.e., Chuska Gray Ware) is present in higher proportions than nonlocal painted wares. The percentages of nonlocal wares at nonstructural sites range from 5.70 percent to 12.62 percent, with the South Addition and Kin Klizhin representing the lowest and highest values respectively. Chi-square tests on local versus nonlocal ceramics by structural versus nonstructural site types were run for each area using the data in Table 4.28. All were significant at the 0.0003 level or better, suggesting that these two variables are not independent. Large sample sizes are affecting these significance levels to some extent, but the lower overall percentages of nonlocal wares at nonstructural, presumably nonhabitation, sites suggests that these wares may have been more highly valued.
Distance to Chacoan Structures or Great Kivas, and Proportion of Chuskan Ceramics
¶ 106 As discussed above, the site type group of Chacoan structures/great kivas has slightly larger quantities of nonlocal ceramics. In order to see if distance to one of these structures within their respective communities had an effect on the proportion of nonlocal ceramics present at a particular site, regression analyses were conducted, along the lines of those discussed by Renfrew (1975, 1977). In the present case, however, the independent variable is not distance to the presumed source of manufacture, but distance to key sites within each community. Thus, this is an intra-community application of a method of analysis first developed for use at the regional level. Although there is little interpretive theory developed for its use at the intra-community level, there is nothing inherent in regression analyses themselves which automatically precludes using them at this scale of spatial organization. Regional level analysis is discussed later in this chapter.
¶ 107 The percentage of trachyte-tempered ceramics in provenience assemblages was used as the dependent variable. Only trachyte-tempered ceramics were used because it could not be assumed at first that all nonlocal wares entered the survey areas via the same exchange mechanisms. Trachyte-tempered ceramics were overwhelmingly the most prevalent, and in fact, all of the tests discussed below were subsequently rerun using all nonlocal ceramics with no significant changes in the results.
¶ 108 The two outlier communities of Kin Klizhin and Kin Bineola were focused on for the analyses, with separate runs for distance to the closest great kiva and distance to the closest Chacoan structure. Only those sites with more than three rooms (“habitation sites”) and a total assemblage of at least 30 sherds were included in order to reduce potential functional biases and the problems involved with small sample sizes. In addition, only sites dating to the two time periods of A.D. 890 to 1025 and A.D. 1030 to 1130 were included. Table 4.29 summarizes the parameters of each test, including the site number of the Chacoan structure or great kiva used for each time period and survey area. In two cases, the same Chacoan structure or great kiva is used twice because their estimated occupation spans cover both time periods. Distances to these structures were calculated as geodesic or straight line distances, using Universal Transverse Mercator (UTM) coordinates. Ceramics with trachyte were calculated as a percentage of all ceramics in a habitation site provenience. Because provenience totals rather than site totals were used, it is possible that the same site is represented more than once on a particular plot, albeit a different part of that site. Using proveniences rather than sites was necessary because as noted earlier in this chapter, different proveniences within the same sites often have different temporal assignments. Grouping of proveniences into sites for this test would therefore have less behavioral relevance than analysis by proveniences.
|
Table 4.29. Great kivas and Chacoan structures used in regression analyses of distance. |
||
|---|---|---|
| Survey Area/ | Date Group (A.D.) | |
| Site Type | 890-1025 | 1030-1130 |
| Kin Klizhin | ||
| Great Kiva | 29SJ
352 (Padilla Wella) |
29SJ
352 (Padilla Well) |
| Chacoan Structure | 29SJ
1413 (Kin Klizhin) |
|
| Kin Bineola | ||
| Great Kiva | 29Mc 261 LA 18707b |
|
| Chacoan Structure | 29SJ 1580 LA 18705 (Kin Bineola) |
29SJ 1580 LA 18705 (Kin Bineola) |
| aPadilla
Well lies outside the Kin Klizhin survey area, ca. 5 km to
the northeast of the Kin Klizhin Chacoan structure. bA.k.a. Kin Bineola Great Kiva 2 (Marshall et al. 1979). |
||
¶ 109 Summarized results of the regression analyses performed on each of the six data sets are presented in Table 4.30. As these results indicate, none of the R2 values are very high. The highest R2 value (0.6335) is found for the computations of distance to the site of 29Mc 261, a great kiva/habitation site in the Kin Bineola area, dated to the A.D. 890 to 1025 time period. But inspection of the plot of distance by percent trachyte indicated that the relationship was the opposite of expected; as distance increased from this site, the proportion of trachyte in the assemblage also increased. The majority of the other tests had weakly negative relationships between distance and percent trachyte; as the former increased, the latter decreased. R2 values of the remaining tests range from 0.0718 to 0.3408. In the case of distance to 29SJ 1580 (the Kin Bineola Chacoan structure) during the A.D. 890 to 1130 time periods the low R2 value (0.1271) is due to the presence of two clusters of habitation proveniences. There is a relative absence of proveniences lying between 1.5 and 3 km from the Chacoan structure.
Table 4.30. Results of regression analyses testing proportion of trachyte temper by distance to Chacoan structures and great kivas.
¶ 110 Based on the low R2 values, it may be concluded that very little of the variability in the relative frequencies of trachyte-tempered ceramics at large structural sites is explained by distance to the contemporaneous Chacoan structures or great kivas within the same outlier communities, even though three of the six tests had significance levels less than 0.05. At least within the 5.5 km maximum distances being tested in these analyses, other factors besides absolute distance appear to be more important. Future analyses should investigate these factors for addition to the regression model.
Regional Comparisons of Ceramic Distribution
¶ 111 Comparisons of the data on ceramic distribution are made at the regional level in two ways. First, comparisons are made to excavated sites in Chaco Canyon, controlling for site type and time period. Second, comparisons are made with Chacoan structures and great kivas throughout the San Juan Basin. Comparisons will be limited to the distribution of trachyte-tempered ceramics because of the relative reliability in the identifications of this temper among assemblages reported by different projects, and in the greater resolution in identifications of the area of production of this ware.
¶ 112 The proportion of trachyte-tempered ceramics present in six Chaco Canyon small house sites excavated by the NPS personnel during the 1970s are listed in Table 4.31. Also listed in this table are the proportions of trachyte temper for the equivalent site type category used during the inventory survey—large structural sites, excluding Chacoan structures and great kivas. For this general functional class, Chaco Canyon sites tend to have slightly higher proportions of trachyte temper within all time periods except the earliest. One Chaco Canyon small house site, 29SJ 629, has a lower proportion of trachyte-tempered ceramics than the mean percentage for the same site type class and time period within the Kin Klizhin area. During the A.D. 890-1025 and 1130-1230 periods, Chaco Canyon small house sites appear to be most similar to large structure sites within the Kin Klizhin area; Kin Bineola large structure sites consistently have lower proportions of trachyte-tempered ceramics than the nearby outlier of Kin Klizhin, or Chaco Canyon sites of the same site type and time period. The only exception to this is during the earliest period of A.D. 550 to 750, when Kin Bineola has the highest percentages of trachyte of any area, either within the canyon or outside. This early high trachyte frequency within the Kin Bineola area, followed by increasingly higher frequencies through time in the other survey areas, may be an important clue to changing distribution systems.
Table 4.31. Summary statistics for percent of trachyte in assemblages of large structural sites by area and date group compared with excavated Chaco Canyon small house sites.
¶ 113 Sites from the survey areas falling into the site type group of Chacoan structures/great kivas are listed in Table 4.32, along with sites of the same general site type group from throughout the San Juan Basin, including the Canyon proper. Also included are period of occupation, percentage of trachyte in the site assemblage and distance from the Skunk Springs community, the closest outlier to the probable locus of production of Chuskan wares (Toll 1985). As this table indicates, there is a wide range in the percentage of trachyte present within Chacoan structures and/or great kiva assemblages, ranging from 80 to 90 percent in the Chuska area itself, to 0 percent in a number of assemblages throughout the Basin.
Table 4.32. Distance from Chuskas and percent of Chuska and Cibola Wares in San Juan Basin Chacoan structure assemblages.
¶ 114 The data in Table 4.32 were analyzed using a simple linear regression model to see how well the data fit a distance-decay model, similar to analyses conducted by Cameron (1984) for the distribution of Washington Pass chert within the San Juan Basin. Three separate runs were made, one for each of the date groups of A.D. 890 to 1025, 1030 to 1130, and 1130 to 1230. Plots of distance from Skunk Springs by the percentage of trachyte are illustrated in Figures 4.10 to 4.12. As these figures show, there is a general trend for the amount of trachyte ceramics to decrease with increasing distance from the presumed area of production in the Chuska Mountains. The R2 values for the three plots increase through time; the linear regression run on the A.D. 890 to 1025 plot has an R2 of 0.3516, the A.D. 1030 to 1130 plot has an R2 value of 0.5182, and the A.D. 1130 to 1230 plot has an R2 value of 0.6179. All of these values are significant at the 0.05 level. Untransformed values were used for these analyses, but regression analyses with logarithmic transformations, as suggested by Hodder (1974) and Renfrew (1977), were also conducted. These decreased, rather than increased, the R2 values.
¶ 115 Of particular interest in these plots are: 1) deviations from the general relationship of increasing distance and decreasing percentage of trachyte; and 2) the placement of the present project’s sites (underlined in each plot). During the A.D. 890 to 1025 period (Figure 4.10), the two survey sites of Kin Bineola and 29Mc 291 both fall close to, and slightly below the projected fall-off line. The great kiva/habitation site of 29Mc 261, also within the Kin Bineola area is much lower than might be expected given this model. Important deviations from the model during this time period (but still falling within the 95 percent confidence interval) are four sites with higher than predicted percentages: Casa del Rio, Peñasco Blanco, Pueblo Bonito, and Una Vida. These four sites are circled on the figure. All four of these, and only these four within this particular plot, fall within what Doyel et al. (1984) have called the ”Chaco Halo,” with the latter three lying in Chaco Canyon proper. It may also be significant that these four sites all lie along what has been suggested to be a major transport corridor—the Chaco Wash itself.
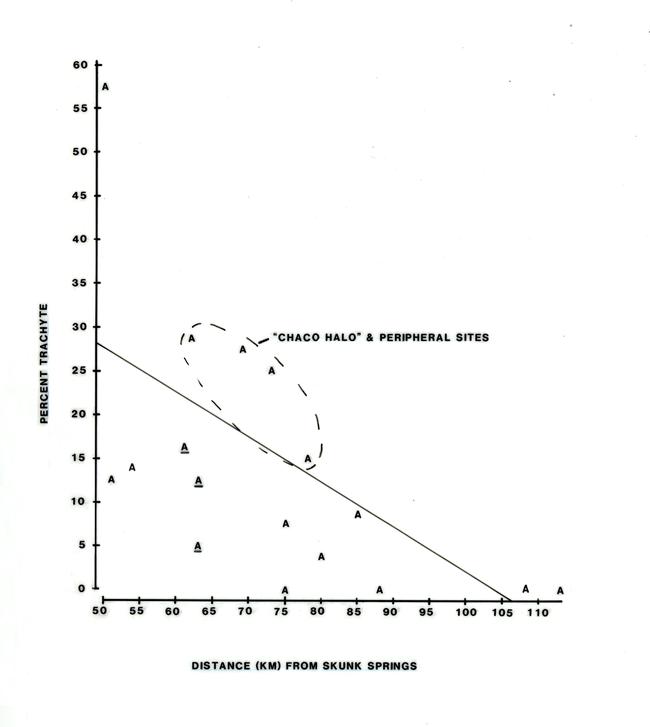 |
Figure 4.10. Plot of percentage of trachyte by geodesic distance from Skunk Springs, A.D. 890-1025. Sites less than 50 km and more than 115 km from Skunk Springs are not shown. Sites from the present project are underlined. A = 1 observation. R2 = 0.3516, Prob >F = 0.0254. |
¶ 116 During the following time period, A.D. 1030 to 1130, the number of sites with Chacoan structures or great kivas in the San Juan Basin increases dramatically, concomitant with the height of the Chacoan regional system. As with the previous plot, the Chacoan structures or great kivas recorded during the present survey all fall near or below the expected line of fall-off from the Chuskas (Figure 4.11). Of these sites, 29SJ 2531, in the Kin Bineola area, is the most aberrant. It has a much lower than expected proportion of trachyte within its assemblage. Also in common with the previous plot are the consistently high proportions of trachyte at sites within Chaco Canyon. These sites form a pronounced step in the fall-off line from the Chuskas, a pattern similar to that noted by Cameron (1984) for the distribution of nonlocal lithic materials. In Figure 4.11, the sites identified by Doyel et al. (1984) as part of the ”Chaco Halo” are encircled with a solid line, while those called ”peripheral sites” are encircled with a dashed line. All of the ”Chaco Halo” sites lie above the projected regression line, while most of the ”peripheral sites” lie just below the line. These latter sites all have higher proportions of trachyte than other sites lying at the same distance from the Chuskan area, evidenced by the fact that they may be encircled on the plot without including any non-peripheral sites.
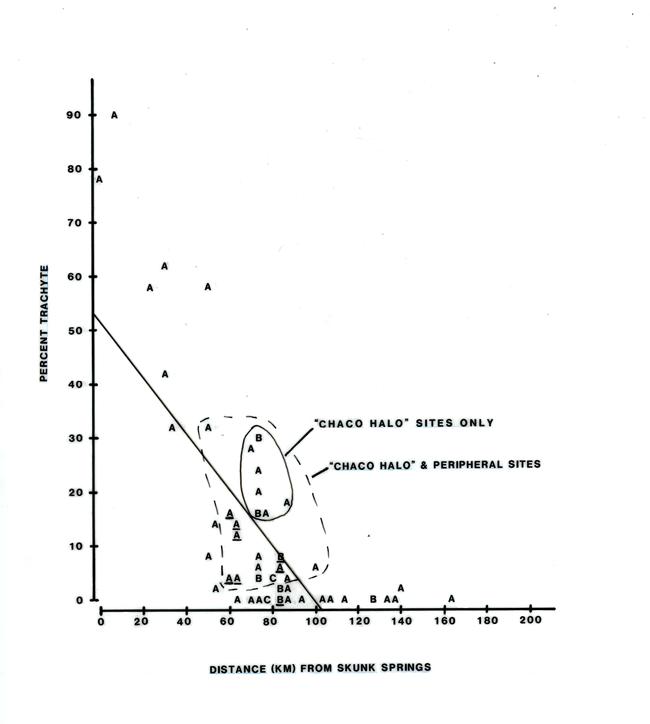 |
Figure 4.11. Plot of percentage of trachyte by geodesic distance from Skunk Springs, A.D. 1030-1130. Sites from the present project are underlined. A = 1 observation, B = 2 observations, C = 3 observations. R2 = 0.5182, Prob >F = 0.0001. |
¶ 117 The last time period graphed, A.D. 1130 to 1230, is the most linear of the three plots, and hence has the highest R2 value (Figure 4.12). In this plot, the only site actually lying within Chaco Canyon is Kin Kletso, but several sites within what Doyel et al. (1984) call the Chaco Halo and its peripheral sites are also represented. As with the previous two figures, these sites all lie above the others. Sites from the present survey represented on this graph are a late occupation at Kin Klizhin, and a Chacoan structure and great kiva within the Chacra Mesa area. Despite the apparent abandonment of the Canyon proper, it is clear that sites within the ”Chaco Halo,” including these survey sites, enjoyed participation in a system of exchange which still allowed some form of higher than expected access to certain nonlocal goods.
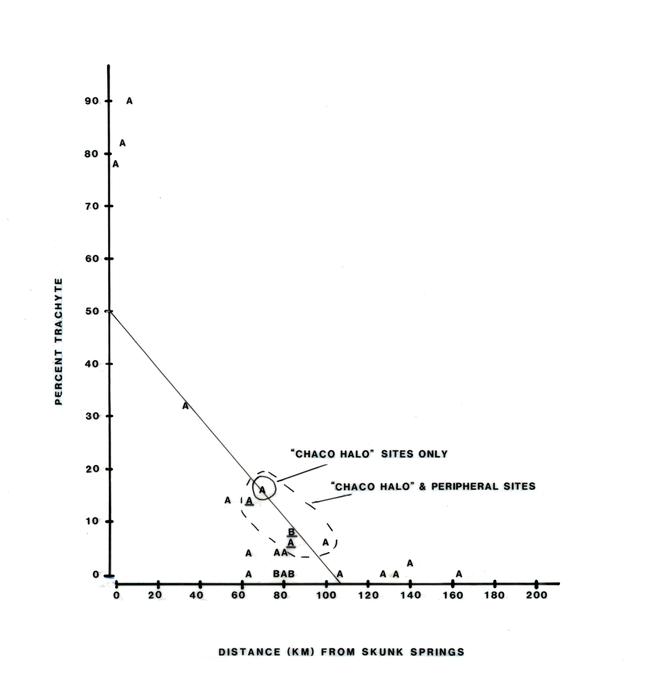 |
Figure 4.12. Plot of percentage of trachyte by geodesic distance to Skunk Springs, A.D. 1130-1230. Sites from the present project are underlined. A = 1 observation, B = 2 observations. R2 = 0.6179, Prob >F = 0.0001. |
Discussion
¶ 118 Models explaining the development of the Chacoan regional system have emphasized redistribution as a means of buffering the cultural system against a heterogeneous and unpredictable environment (Altschul 1978; Grebinger 1973; Judge 1979). Using data from central Chaco Canyon, Toll (1981) identified and tested two implications of the redistributive model for ceramics: 1) the presence of specialized production and 2) the greater diversity of vessel forms and fabrics at the putative centers of redistribution. While metric variation in the nonlocal ceramics suggested possible specialist-made ceramics, and these nonlocal ceramics were present in greater frequencies at the Pueblo Alto great house, Toll (1981) also found that the diversity of forms was actually higher at the small house sites, and that there was little evidence for redistribution of nonlocal ceramics to outliers within the system. He suggests that Chaco did not redistribute nonlocal (particularly Chuskan) ceramics, but was the end point in the distributional system. He rejects the application of the redistributive model to ceramics (but leaves open the question for other goods), and suggests instead that another process must be used to explain the high proportion of nonlocal graywares within the plainware assemblages at large sites within central Chaco Canyon. The suggestion is made that the great houses in Chaco Canyon served as periodic gathering places, possibly by nonpermanent populations who brought Chuskan ceramics to Chaco on an annual basis (Toll 1981, 1984, 1985).
¶ 119 How do the data collected during the present project inform on this problem? It was shown that the nonlocal ceramics at all four of the survey areas are dominated by the same ware as within Chaco Canyon—Chuska Gray Ware. The relative frequencies of this ware at Chacoan structures and great kivas do not reach the proportions found within central Chaco, however, generally supporting Toll’s observation that outliers do not have as high a percentage as the Chaco great houses. Nor can it be said that there is consistent contrast between the central or focal sites and other sites within the outlier communities in the percentages of nonlocal ceramics. The site of Kin Bineola itself has significantly higher percentages of nonlocal ceramics than contemporaneous habitation sites within the same community, but the site of Kin Klizhin does not. Yet, during four of the five temporal periods, the Kin Klizhin area as a whole has higher percentages of nonlocal ceramics than that of the Kin Bineola area.
¶ 120 Thus, while some of the ceramic expectations of a redistributive model are met, some are not. But, are the test implications necessarily those which will adequately test the proposed redistributive model? Specialized production may be present in all redistributive economies, but the converse of this is not always true: all specialized production does not occur within redistributive economies. Neither do all deviations from a normal distance decay model necessarily represent the same kinds of distribution systems (Hodder 1974).
¶ 121 Based on ethnographic data, Hodder (1979) has shown that patterned deviations from the linear fall-off model, such as are illustrated above, may not necessarily be due to the mode of exchange per se, as earlier proposed by Hodder (1974) and Renfrew (1975, 1977), but rather, to the mode of distribution. He demonstrates that two groups with similar modes of production and similar levels of socio-political complexity may have very different distributional patterns, depending on whether the mode of distribution is a primary system or a secondary system.
¶ 122 Primary distribution systems are those where the ceramics produced go directly to the consumer. Secondary systems pass through other consumers, middlemen, or even markets. Secondary distribution systems usually result in the ceramic item being finally used further away from the areas of production than in primary systems. But in the case of the Njemps pottery reported by Hodder (1979), pottery that went directly to the consumer went further than ceramic items which were distributed in a ”down-the-line” fashion. In fact, it was less costly for the consumer to go to the place of manufacture, combining the procurement of ceramic items with that of other items, than it was for the consumer to purchase through a middleman. The falloff curve for Njemps utilitarian pots more resembled that for highly valued goods because of this mode of distribution.
¶ 123 The case described above, although a single example more resembling a cautionary tale, is a significant one for two reasons. First, it points out that spatial patterns of ceramic distribution may be embedded within other, more important economic activities. These activities may be less visible from an archaeological point of view, yet will have similar distributional patterns to ceramics procured via other means. Second, it points out a case where plainwares, not the presumed highly valued painted wares, are the wares showing the most deviation from a normal distance-decay or linear fall-off model.
¶ 124 The redistribution model implies a secondary distribution system. The alternative model proposed by Toll (1981, 1984, 1985) suggests primary distribution. The difference between these two forms of distribution may be stated more simply as whether the goods are being brought to the consumers, or the consumers are going to the goods. What are the test implications for these two different modes of distribution? Unfortunately, there are no clear correlations of patterns of production and patterns of distribution. In either case, specialization of production at some level may be present. Also, either plainware or painted ware may be the distributed product. It is precisely this lack of clear correlations between production and distribution systems that caused Peacock (1982) to point out the need for analytically separating the two modes of distribution.
¶ 125 Therefore, the possibility of either primary or secondary modes of distribution of ceramics (or a third alternative, some combination of the two) is left open. These are alternative reconstructions of the same archeological evidence. While redistribution per se may not have been the specific mechanism of ceramic distribution, we still can not ascertain whether the Chuskan ceramics were being distributed by people taking them to other areas of the San Juan Basin, or whether residents outside the Chuskas are going into this area to personally procure their own.
¶ 126 Based on the distributional data presented above, however, it does appear that the production and distribution of Chuska Gray Ware was at a different organizational level than that of other nonlocal ceramic wares entering the central basin. Why should the Chuskan area be the locus of such activity? Toll (1981) has suggested that the lack of firewood in the central Basin may have limited production in this area. In addition, certain high elevation areas of the Chuskas may have been susceptible to early and late frosts making agricultural production more risky. Both of these suggestions fit with ethnographic examples of specialization of ceramic production (Arnold 1978, 1985; Howry 1978; Peacock 1982). Firewood is a critical, often limiting, variable for ceramic production and it has been ethnographically demonstrated that where land is poor for agriculture, but an abundance of firewood is present, ceramic production is frequently an important economic activity.
¶ 127 Clearly there is more need for research on production and distribution systems in the San Juan Basin. In particular, further comparative work is needed on economic systems that had a similar level of productive specialization to the Chuskan system—one of incipient specialization in plainware production and with a concentrated population of consumers lying at a distance of 60 to 100 km away. Both primary and secondary distribution systems need to be studied in greater detail in order to generate test implications which may be applied to the San Juan Basin data.
Functional Variability in the Ceramic Assemblages
¶ 128 Relatively little research has been conducted on the functional aspects of ceramic assemblage content in the San Juan Basin. Although there is a high degree of variability in nonartifactual remains in this area, perhaps more so than any other area of the Southwest, analyses of ceramic assemblages have concentrated on problems of typology, chronology, and patterns of trade and exchange. In this section, the ceramic assemblages will be analyzed in terms of a limited number of variables relating to ceramic vessel function. A brief review of previous research on inter-site analyses of ceramic assemblage function in the San Juan Basin is first provided.
Previous Research
¶ 129 Although few functional analyses have been conducted on ceramic assemblages within or near the San Juan Basin, some current examples are summarized here to illustrate trends in and potential problems with such studies.
¶ 130 One such study was based on excavation data from the McKinley Mine Project in the extreme southwestern portion of the San Juan Basin, just north of Gallup, New Mexico (Acklen 1982). The sites were divided into residential and nonresidential categories, and ceramic attributes of sherds between these two categories were contrasted. Functional attributes analyzed included bowls versus jars, utility versus decorated sherds, fire blackened versus unblackened sherds, and variety of formal classes. No exclusive associations of one ceramic class with either of the site categories were found. Nonresidential sites were found to have a larger proportion of jars, slightly lower variety of vessel forms, a (surprisingly) higher ratio of decorated to utility sherds, and, if one considers Acklen’s Table 16.14 rather than the text, a lower proportion of plainware sherds with fire blackening.
¶ 131 Sebastian (1983b) used both excavated and surface sherd data from the Lower Chaco River area, but in contrast to the above analysis, ceramics were used in addition to site structure to initially define site categories. Four site types were derived: 1) structural sites with ”normal” ceramic assemblages, 2) nonstructural sites with ”normal” assemblages, 3) structural sites with jar-dominated assemblages, and 4) nonstructural sites with jar-dominated assemblages. ”Normal” assemblages were defined as those with approximately 70 percent utility and 30 percent decorated ceramics, of which approximately 60 percent of the latter were jars. Jar-dominant assemblages had over 90 percent jars, including both decorated and plainwares. Other inter-site characteristics of potential functional significance were compared among these categories, including hearth locations, ethnobotanical taxa variety, and taxa seasonality. Based on all of these characteristics, the four site types were interpreted to represent 1) habitation sites, 2) fieldhouses, 3) day-use sites, and 4) storage sites. Then, an additional ceramic assemblage variable was compared among the four site types: the distribution of rim diameters. The results of this comparison showed that only habitation sites had a normal distribution. Field house and day use sites’ orifice diameter distributions were both skewed to the left (having higher proportions of sherds with large diameters), whereas storage sites had distributions slightly skewed to the right (having more rim sherds with small rim diameters).
¶ 132 The above two studies are interesting for two reasons. First, they suggest specific ceramic assemblage variables which may be used for functional comparisons. Second, they demonstrate that some patterning is present in the distribution of these ceramic assemblages when compared with site classes within the San Juan Basin. Sebastian’s (1983b) study is particularly interesting for the ethnographic literature search documenting how ceramics and site structure might be expected to vary among the different site types. But, the above two studies also point out two problems which may be encountered. As Acklen (1982) points out, his dual classification of site types into residential and nonresidential categories is probably too gross for looking at ceramic assemblage variability. Sebastian’s (1983b) study incorporates both structural and ceramic assemblage variables into the initial classification of sites, and therefore independent patterning in the ceramic assemblages is difficult to assess.
¶ 133 An analysis conducted by Camilli (1988) was applied to assemblage data from the southern edge of the Anasazi area, near Quemado, New Mexico. Although this area lies outside of the San Juan Basin, her analysis is relevant to the present one. Camilli’s analysis was conducted in several steps. First, she conducted univariate analyses of assemblage variables by site structural data. Then, she identified assemblage clusters generated on the basis of proportions of five ceramic sherd categories: 1) gray ware, 2) jars, 3) decorated jars, 4) red ware, and 5) plain ware (gray ware and brown ware). Finally, Camilli compared the resulting clusters of ceramic assemblage data with the site structural data. Her approach has two advantages over the others for the purposes of the current study. First, she used large samples of surface assemblages consisting only of sherds, rather than excavation data. And second, she looked at ceramic assemblages independently of site structural data.
¶ 134 The five site structural categories used by Camilli were 1) lithic/ceramic scatters without features, 2) scatters with features, 3) scatters with structures, 4) roomblocks, 5) rooms, and 6) middens. Based on the univariate analyses of proportions of utility wares, decorated wares, and all jars, Camilli found that scatters without structures had the highest coefficients of variation (CVs) while middens had the lowest CVs. The inference was made that middens represented assemblages of redundant activities, while the scatters represented more sporadic and more highly variable activity usage. In general, assemblages from lithic/ceramic scatters with and without features were more similar to each other, while assemblages from rooms, roomblocks, and middens formed another group. The results of her cluster analysis on the five ceramic assemblage variables produced 16 clusters, most of which showed a high degree of internal consistency when compared to the site structural categories.
¶ 135 The current approach follows Camilli (1988) by first conducting univariate analyses of the Anasazi sherd assemblage variables and then using these variables in a clustering procedure independent of site structural data. In contrast to Camilli’s analysis, slightly different ceramic variables are used in the cluster analysis of the sherd data, variables which are mutually exclusive, rather than overlapping. The groups derived from the cluster analysis are compared with nonceramic characteristics of the sites using the deposit type, site type, and feature type designations recorded in the field for each assemblage. Finally, the temporal and spatial distributions of these assemblage groups are considered.
Identification of Functional Variables
¶ 136 The most commonly used functional variables of ceramics have been the gross formal categories of bowls versus jars. These categories are less than satisfying because all bowls or all jars cannot be assumed to have been used for the same purpose. But these categories are commonly, and relatively consistently identified among sherd collections, and comparisons are therefore more easily made on inter-site and inter-project bases. Another attribute of ceramic variability which may be fairly confidently related to functional variability is surface treatment, i.e., the division of sherds into painted and ”utilitarian” or unpainted categories. These two attributes, form and surface treatment, are the only functionally sensitive ceramic variables which were recorded during the present survey project. In order to maximize the number of potential functional classes, they were combined in the following analyses, resulting in three classes: 1) decorated jars, 2) plainware jars, and 3) decorated bowls. Plainware bowls do not occur within the sample.
¶ 137 Comparison of the total number of sherds in each of the three ceramic classes by site type group is shown in Table 4.33. This table considers all time periods together, but is subdivided by the four survey areas. At nearly all of the site type groups, plainware jars are the dominant ceramic class present. In general, structural sites (the first three columns) have slightly larger percentages of decorated bowls, lower percentages of decorated jars, and higher percentages of plain jars than nonstructural sites. There are exceptions to all of these generalities, however, within each survey area. One clear distinction is that the structural sites have a much smaller range of percentages of each one of these ceramic classes than do the nonstructural sites. This suggests that the trends noted by Camilli (1988) for the Quemado area (summarized above) may also be true of these San Juan Basin assemblages.
Table 4.33. Ceramic vessel class frequencies by site type group and survey area.
¶ 138 In order to make Camilli’s results more directly comparable, coefficients of variation (CVs) were calculated for each of the three ceramic variables by site types (Table 4.34). Expressed as percentages, CVs allow comparison of the dispersion of proportional values around the means of each of the ceramic classes across the site type designations. This measure is preferred to the standard deviation when the sample means of the groups being compared are not the same (Thomas 1976). By contrast to Table 4.33, only assemblages with 20 or more sherds are included in Table 4.34, with each variable expressed as a percentage of each assemblage. In addition, the large structure category was subdivided into those with surface rooms (”roomblocks”) and those with subsurface rooms (”pithouses”), and Chacoan structure proveniences were separated from those of great kivas. As the table shows, all site types which have structures have lower CVs for the plainware variable than do nonstructural site types. This is also generally true of the painted bowl ceramic class. CVs for the decorated jar class show that while four of the five lowest values are for structural sites, the highest value is also for a structural site type—pithouses. Other than pithouses, fieldhouses tend to have the highest CVs (i.e., are the most variable) of any of the structural sites, while sherd and lithic scatters have the lowest CVs of any of the nonstructural site types. Thus, fieldhouses may be interpreted as having more activity variability than any of the other structural site types, and may indicate that this site type—assigned solely on the basis of the presence of three rooms or less—may contain functional subgroups. Conversely, sherd and lithic scatters, with their relatively low CV value for a nonstructural site type, indicate high activity redundancy. It is possible that the low CV values for sherd and lithic scatters is indicative of the presence of buried structures.
Table 4.34. Univariate analysis of ceramic assemblage variables by site types.
¶ 139 In terms of the mean percentages of the ceramic variables, several site types show remarkably similar values. Roomblock, Chaco structure, and great kiva assemblages have nearly identical percentages of the three assemblage values, particularly when considering plainware jars, the most ubiquitous and possibly most reliable ceramic class (mean of 66 percent for all three site types). Ledgeroom, fieldhouse, and fieldhouse/water control assemblages form another group (mean percentages of plainware jars at 61-62 percent), while sherd scatters and roads/trails have mean percentages of 51-52 percent. The class of sherd/lithic scatters, with a mean percentage of 59 percent plainware jars, is actually closer to the ledgeroom, fieldhouse, and fieldhouse/water control class than to the sherd scatters and roads/trails sites, further supporting the idea that this site type may contain buried structures. Pithouses and baking pits have high and low mean percentages of plainware jars, respectively, and are unlike any other site types. Hearths are most similar to the roomblock, Chaco structure, great kiva group with respect to mean percentages, but with a much wider range of variability (as the high CV values show).
¶ 140 Assemblage size has been recognized to be a significant variable in the use of certain statistical analyses of assemblage variability such as diversity measures (Grayson 1984; Jones et al. 1983). It is important, therefore, to understand the relationship between assemblage size and the other variables of interest, even for the simple univariate measures discussed above. All of the assemblages included in the current analysis of assemblage function were selected on the basis of the presence of 20 sherds or more. A histogram of the remaining assemblages by assemblage size indicates that the distribution is still highly skewed toward small sample sizes (Figure 4.13). Although the mean assemblage size is 129 sherds, the single mode is considerably less, at 20 sherds. Mean assemblage size broken down by site type (Figure 4.14) shows that sample size among the site types is far from uniform. The large structure, Chaco structure, and great kiva proveniences clearly have mean sample sizes greater than all other site types (means ranging from 166 to 521 sherds/assemblage). All other proveniences associated with structures and all nonstructural proveniences are, however, quite similar (means ranging from 44 to 109 sherds/assemblage). Thus, the low CV values for the large structural sites (including the Chaco structures and great kivas) is correlated with large assemblage size. This is not an entirely unexpected result; as sample size increases, it might be predicted that the statistical distribution will become more normal (assuming no subgroups are present), and the CV measures one aspect of this normality. But, the similarity in the mean assemblage sizes of the small structural and nonstructural proveniences suggests that assemblage size alone is not responsible for the differences in the CV values observed in the univariate analyses.
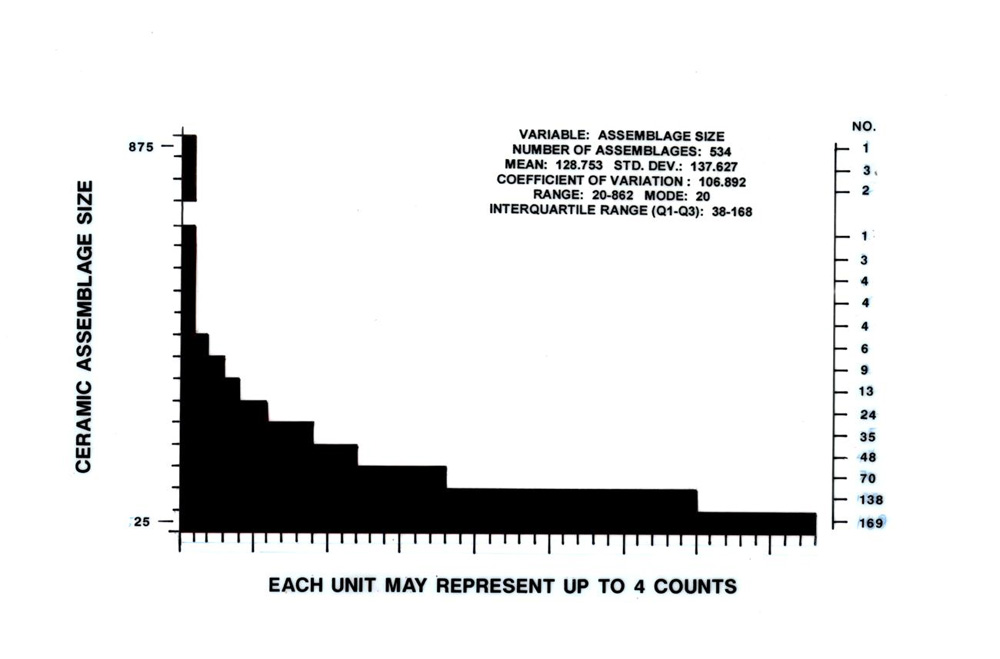 |
Figure 4.13. Histogram of ceramic assemblage size showing Anasazi assemblages with 20 sherds or more. Each unit or block on the x-axis represents four assemblages of a given size. The number of assemblages is shown on the right y-axis. |
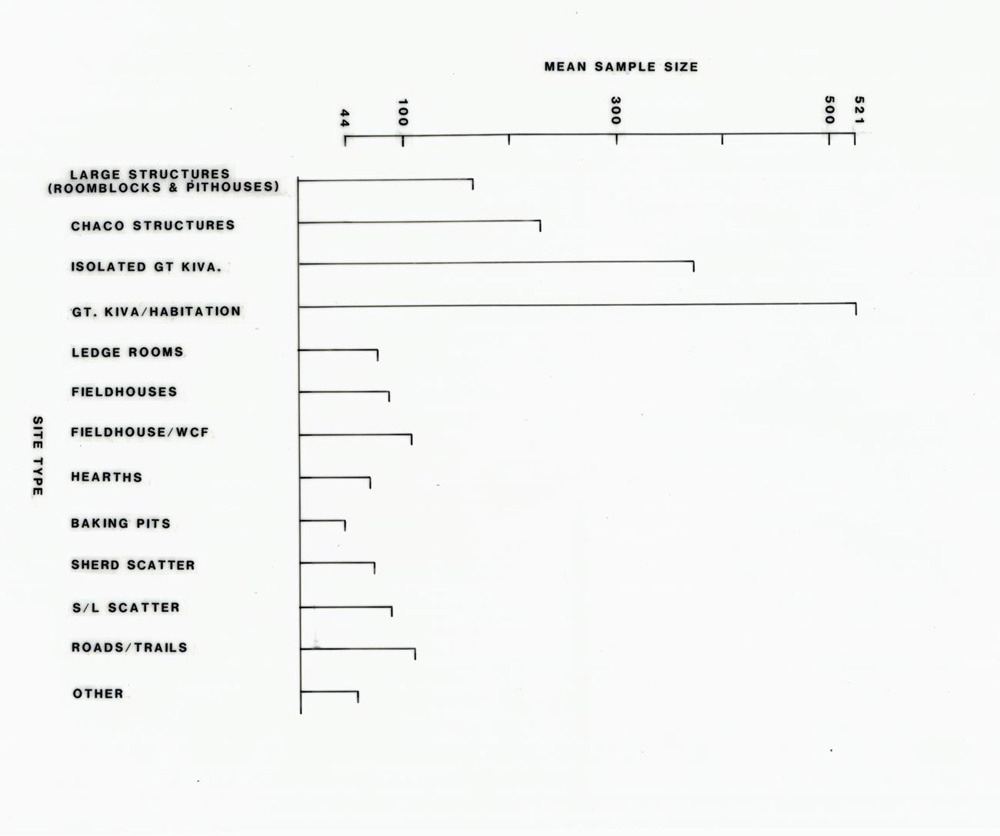 |
Figure 4.14. Distribution of mean sample size of ceramic assemblages by site types. |
¶ 141 We may conclude two things from the above discussion. First, there does appear to be covariation between functionally sensitive ceramic assemblage variables and site structural variables, at least as much as the latter is reflected in the site type designations. Second, the observation made by Camilli (1988) that structural sites tend to have narrower ranges of variability (as measured by the CVs) than do nonstructural sites appears to be supported with the present survey data, but the effect of large assemblage size on the values for the largest of the structural sites cannot be ignored.
Cluster Analysis of Ceramic Assemblages
¶ 142 As noted in the review of previous analyses of interassemblage ceramic variability, one problem has been the lack of analyses focusing on the patterning among ceramic assemblages independent of the other site attributes. The remainder of this section analyzes the ceramics as assemblages independent of the site structural data, and then compares the results with these data. A univariate analysis of the three ceramic classes is presented first, followed by a cluster analysis of these classes. The goal of the former is to understand the distribution of each of these variables when they are considered independently of the site structural data. The goal of the latter is the identification of potentially significant groups of assemblages which may then be compared with the site structural information of site types, feature types, and deposit types. As noted earlier, this kind of approach has been rare in previous ceramic analyses using Southwestern data. Temporal differences among the assemblages were not initially controlled for in the following analysis for one major reason: the temporal designations cannot be considered completely independent of the proportions of the three ceramic variables. Although decorated types and plainware rim sherds were relied on for the temporal designations made during the present project, it is still a bias of many analyses that assemblages which are nearly exclusively plainware are assumed to be earlier than those with decorated types. By keeping the temporal groupings separate from the initial cluster definitions, independence of these variables can be ensured for subsequent comparisons.
¶ 143 Each one of the ceramic classes—decorated bowls, decorated jars, and plainware jars—was treated as proportional data by calculating the percentage of that class within each assemblage. Assemblages here are the equivalent of proveniences, the smallest unit of recording, and each has an associated feature designation. As with the data presented in Table 4.33, only assemblages of 20 or more ceramic artifacts were included as a compromise between the problem of small sample size and the elimination of potentially important functional variability. Smaller sized assemblages would be subject to sample size problems and would result in inflated proportional data. The 20 sherd cutoff was chosen instead of a larger size, because it is probable that assemblage size is related in some way to site function. Using this cutoff, a total of 534 Anasazi assemblages were available for analysis.
¶ 144 Figures 4.15a-c present univariate data on each of the three ceramic classes of decorated jars, plain jars, and decorated bowls. These data include summary statistics and histograms for each proportional class. As shown, plainware jars are the predominant class within most assemblages. The mean proportion of this class is 65.26 percent, compared to mean proportions of decorated jars at 20.30 percent and decorated bowls at 14.43 percent. High CV values, i.e., those above about 10 percent, are generally indicative of underlying variability within the sample, such as the presence of subgroups (Thomas 1976). As the CV values for the three ceramic classes indicate, all three are highly variable and probably contain subgroups. The presence of subgroups is also suggested by the histograms for at least the decorated and plainware jar categories. As Figures 4.15a and 4.15b indicate, the distribution of the proportions of these two classes suggest bimodality. The cluster analysis discussed next explores the division of these classes into subclasses to identify some of this underlying variability.
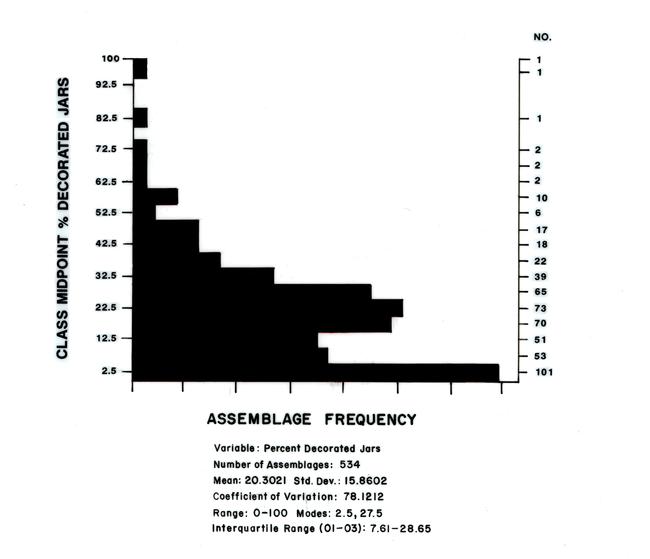 |
Figure 4.15a. Histogram showing range of decorated jar percentages in ceramic assemblages. For example, there are 73 assemblages where decorated jar sherds account for 20-25% (midpoint of 22.5%) of the ceramic assemblage. |
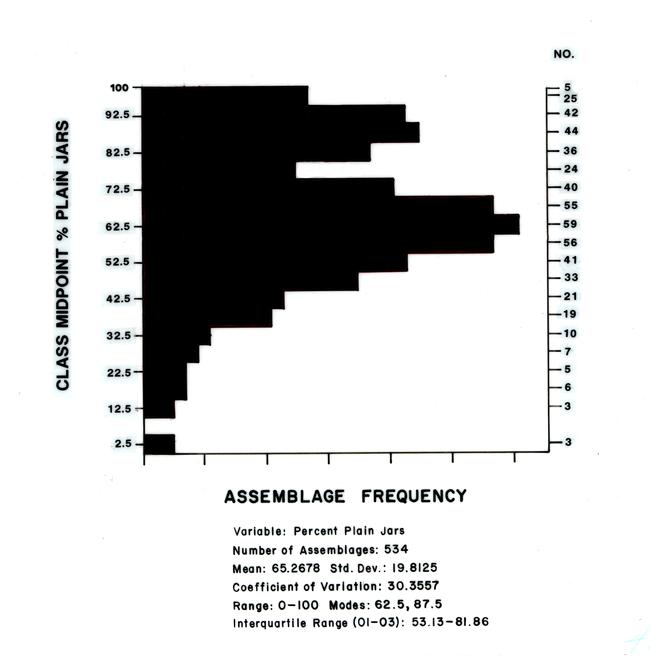 |
Figure 4.15b. Histogram showing range of plain jar percentages in ceramic assemblages. For example, there are 10 assemblages where plain jar sherds account for 30-35% (midpoint of 32.5%) of the ceramic assemblage. |
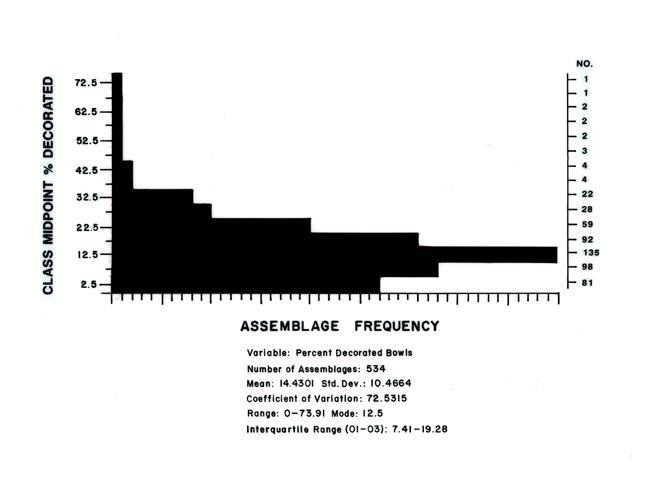 |
Figure 4.15c. Histogram showing range of decorated bowl percentages in ceramic assemblages. For example, there are 81 assemblages where decorated bowl sherds account for 0-5% (midpoint of 2.5%) of the ceramic assemblage. |
¶ 145 Using the proportions of the three ceramic classes of decorated jars, plainware jars, and decorated bowls, the cluster analysis was conducted as a pattern search technique for identifying functional variability among the assemblages. The goal of this analysis was the identification of groups of assemblages with similar proportions of the three ceramic vessel types. The general hypothesis to be tested is: if the ceramic assemblage variables selected are functionally sensitive, there should be some correlation between ceramic assemblage vessel form groups and nonassemblage characteristics such as deposit type, site type, and feature type data.
¶ 146 The analysis was conducted on the 534 Anasazi ceramic assemblages with 20 or more sherds and was conducted in three steps. First, the CLUSTER procedure of SAS was used to try to identify how many clusters were present in the data. The results of this analysis indicated that there was a large amount of variability in the data, such that the number of clusters probably exceeded 50 if not more. In order to identify clustering in the data at a more usable scale, the next step in the analysis used the FASTCLUS procedure, imposing a 20 cluster limit on the data. Then, the mean proportions of each ceramic class within the 20 clusters were plotted in order to determine through visual inspection, possible groups of clusters.
¶ 147 The results of the FASTCLUS procedure are shown in Table 4.35. Listed in this table are the cluster number, the mean proportions of each of the three ceramic classes within that cluster, and the number of assemblages in each cluster. As indicated, there is wide variability in the number of assemblages falling into any single cluster, ranging from 1 to 90. The largest cluster is cluster 10, which has cluster means of 54 percent plainware jars, 28 percent decorated jars, and 18 percent decorated bowls.
|
Table 4.35. Mean percentages of functional ceramic classes in assemblages derived from cluster analysis — K-Means method. |
||||
|---|---|---|---|---|
| Cluster No. | No. of Members | Decorated Jars | Plainware Jars | Decorated Bowls |
| Group A | ||||
| 5 | 2 | 98.39 | 1.08 | 0.54 |
| 15 | 4 | 73.26 | 20.81 | 5.93 |
| 16 | 13 | 51.55 | 23.25 | 25.20 |
| 18 | 11 | 56.58 | 34.04 | 9.38 |
| Group B1 | ||||
| 2 | 11 | 8.15 | 56.28 | 35.57 |
| 3 | 14 | 5.10 | 70.21 | 24.69 |
| 4 | 25 | 44.75 | 45.37 | 9.88 |
| 6 | 74 | 19.58 | 70.11 | 10.30 |
| 10 | 90 | 28.06 | 54.37 | 17.57 |
| 12 | 21 | 33.82 | 60.60 | 5.58 |
| 17 | 65 | 17.41 | 64.15 | 18.45 |
| Group B2 | ||||
| 8 | 31 | 12.14 | 83.44 | 4.42 |
| 19 | 56 | 1.52 | 94.91 | 3.57 |
| 20 | 73 | 4.21 | 85.73 | 10.06 |
| Group C | ||||
| 1 | 3 | 3.99 | 42.49 | 53.53 |
| 7 | 2 | 10.23 | 25.97 | 63.80 |
| 11 | 1 | 26.09 | 0.00 | 73.91 |
| 13 | 3 | 28.58 | 17.17 | 54.25 |
| Group D | ||||
| 9 | 5 | 18.28 | 40.05 | 41.67 |
| 14 | 30 | 31.95 | 41.31 | 26.74 |
¶ 148 The cluster means listed in Table 4.35 were plotted on Figure 4.16. The triangular graph allows three percentages to be plotted with one data point, in this case, the mean proportions of decorated jars, plainware jars, and decorated bowls within each of the 20 clusters. Visual inspection of the percentage plots suggests that five groups of clusters may be identified in the data. Group A is a relatively dispersed group of four clusters, each of which has greater than 50 percent decorated jars. The four clusters making up this group individually contain few members, and the entire group contains only 30 assemblages. While the univariate plot of decorated jars suggests bimodality, the cluster with greater than 95 percent decorated jars was not separated from the rest of the clusters in this group because it only contains two assemblages.
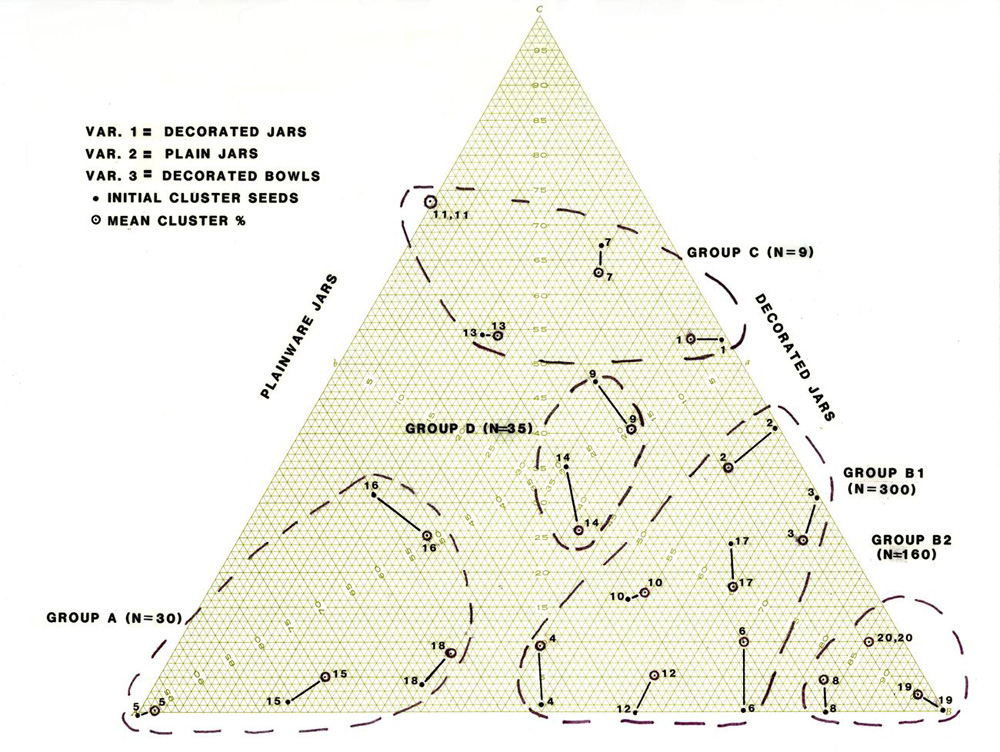 |
Figure 4.16. Percentage plots of clusters of decorated jars, plain ware jars, and decorated bowls. |
¶ 149 Group B consists of all assemblages containing greater than 45 percent plainware jars. This group contains the largest number of assemblages. This group was broken down into two subgroups; B1, containing from 45 percent to 70 percent plainware jars, and B2, containing greater than 80 percent plainware jars. This subdivision was based on the presence of the two modes observed in the histogram of this assemblage variable (Figure 4.15b). Group C, the smallest group identified, consists of only nine assemblages in four clusters, all having greater than 50 percent decorated bowls. The final group, Group D, consists of 35 assemblages in two clusters which do not have a majority of any of the three functional classes of decorated jars, plainware jars, or decorated bowls.
¶ 150 The five proposed groups of assemblages identified above were compared with site structural data in the form of the deposit type, site type, and feature type groups identified in the field. It should be remembered that every site has a site type designation, but that the ceramics were recorded by proveniences within sites, each of which has an associated feature designation. Assemblages here refer to proveniences, not total site assemblages, thus preserving the more fine-grained, and presumably more secure spatial associations. Therefore, while the site types are important for structural information on the entire spatial unit recorded as a site, the feature type designations are probably most related to the use of the assemblage being considered.
¶ 151 Considering first the comparison by deposit type, the most revealing category is that of trash mound deposits (Table 4.36). The trash mound category was only applied to formal refuse deposits, usually found at large structural sites (mostly associated with roomblocks) and Chacoan structures. Most of the assemblages from these deposits (78 percent) were classified as Group B1, assemblages with between 45 percent and 70 percent plainwares. This suggests that the ceramic proportions at sites with formal trash deposits, which were likely produced by habitation activities, are as highly structured as is the pattern of formal trash disposal itself. By contrast to the trash mound deposits, the other two deposit types, structure/features and scatters, were not strongly associated with one particular assemblage group.
|
Table 4.36. Frequency of assemblages in functional groups by deposit types. |
|||||||||||
|---|---|---|---|---|---|---|---|---|---|---|---|
| Ceramic Assemblage Group | |||||||||||
| A | B1 | B2 | C | D | |||||||
| Deposit Type | No. | % | No. | % | No. | % | No. | % | No. | % | Total |
| Trash Mound | - | - | 38 | 77.55 | 7 | 14.29 | - | - | 4 | 8.16 | 49 |
| Refuse Scatter | 26 | 7.07 | 192 | 52.17 | 123 | 33.42 | 5 | 1.36 | 22 | 5.98 | 368 |
| Structure/Feature | 4 | 3.42 | 70 | 59.83 | 30 | 25.64 | 4 | 3.42 | 9 | 7.70 | 117 |
| TOTAL | 30 | 300 | 160 | 9 | 35 | 534 | |||||
¶ 152 Interestingly, not all of the assemblage clusters within Group B1 are equally represented within the trash mound category. Most of the trash mound assemblages are comprised of only three of the clusters: 6, 10, and 17. These three clusters are located close to each other on the percentage plot shown in Figure 4.16. They indicate a tight range of proportions in the three functional classes of ceramics from trash mounds: from 17 percent to 28 percent decorated jars, 54 percent to 70 percent plainware jars, and from 10 percent to 18 percent decorated bowls. Thirty-seven of the 49 trash mound assemblages (76 percent) fall into these ranges. The “normal” assemblages identified by Sebastian (1983b) for the Lower Chaco River area also fall within the above ranges, at approximately 18 percent decorated jars, 70 percent plainware jars, and 12 percent decorated bowls, suggesting that this pattern extends beyond the assemblages considered in the present survey area and may be a basin-wide pattern.
¶ 153 Although only 49 of the assemblages were identified as being associated with formal trash deposits, they are important because they are an index, against which many of the other assemblages may be compared. Based on the results of the comparisons of the assemblage groups with the deposit types, it may reasonably be inferred that deviations from the proportions most commonly found within trash mounds are less likely to be the result of habitation activities. And conversely, assemblages with similar proportions to the trash mounds might reasonably be concluded to have been produced through habitation activities.
¶ 154 The comparison of site types with the ceramic assemblage groups shows some interesting trends (Table 4.37). First, the site types of Chacoan structures and great kivas site show remarkable homogeneity. Nearly all of the assemblages from sites of these types fall into the ceramic assemblage Group B1, proposed to represent assemblages resulting through habitation. Sites which were classified in the field as habitations (i.e., roomblocks), however, do not show the same degree of homogeneity with respect to ceramic assemblage group. While 63 percent were placed in Group B1, 27 percent were placed in Group B2 which has over 80 percent plainware. Pithouses, separated here but also recorded as “habitation” in the field, have the greatest percentage of proveniences falling into Group B2. Most of these Group B2 proveniences fell into cluster 20, which has mean percentages of 4 percent decorated jars, 86 percent plain jars, and 10 percent decorated bowls. Thus, with the exception of pithouses, all of the site types which may be considered as large structural sites generally have Group B1 assemblages.
|
Table 4.37. Frequency of assemblages in functional groups by site types. |
|||||||||||
|---|---|---|---|---|---|---|---|---|---|---|---|
| Ceramic Assemblage Group | |||||||||||
| A | B1 | B2 | C | D | |||||||
| Site Type | No. | % | No. | % | No. | % | No. | % | No. | % | Total |
| Chacoan Structure | - | - | 14 | 87.50 | 2 | 12.50 | - | - | - | - | 16 |
| Great Kiva | - | - | - | - | - | - | - | - | 1 | 100.0 | 1 |
| Great Kiva/Habitation | - | - | 3 | 100.0 | - | - | - | - | - | - | 3 |
| Roomblocks1 | 4 | 1.80 | 140 | 63.06 | 59 | 26.58 | 2 | 0.90 | 17 | 7.66 | 222 |
| Pithouses1 | - | - | 7 | 17.50 | 32 | 80.00 | - | - | 1 | 2.50 | 40 |
| Fieldhouse | 6 | 7.89 | 41 | 53.95 | 20 | 26.32 | 2 | 2.63 | 7 | 9.21 | 76 |
| Ledgeroom | 1 | 5.00 | 15 | 75.00 | 3 | 15.00 | - | - | 1 | 5.00 | 20 |
| Fieldhouse/Water Control | 1 | 14.29 | 5 | 71.43 | 1 | 14.29 | - | - | - | - | 7 |
| Baking Pit | 1 | 33.33 | 1 | 33.33 | 1 | 33.33 | - | - | - | - | 3 |
| Hearth | 4 | 6.56 | 25 | 40.98 | 28 | 45.90 | 3 | 4.92 | 1 | 1.64 | 61 |
| Road/Trail/Stairs | 4 | 25.00 | 10 | 62.50 | 2 | 12.50 | - | - | - | - | 16 |
| Sherd Scatter | 7 | 20.59 | 18 | 52.94 | 5 | 14.71 | - | - | 4 | 11.76 | 34 |
| Sherd/Lithic Scatter | - | - | 9 | 56.25 | 4 | 25.00 | 1 | 6.25 | 2 | 12.50 | 16 |
| Other/Unknown | 2 | 10.53 | 12 | 63.16 | 3 | 15.79 | 1 | 5.26 | 1 | 5.26 | 19 |
| TOTAL | 30 | 300 | 160 | 9 | 35 | 534 | |||||
| 1Roomblocks and pithouses are members of the site type habitation. | |||||||||||
¶ 155 Small structural sites (fieldhouses, ledgerooms, and fieldhouse/water control site type designations) also have a majority of assemblages falling into Group B1, but there is greater diversity in the assemblage groups represented. Within the fieldhouse designation, there are over 26 percent of the assemblages which are classified as Group B2, the same percentage as for sites with roomblocks. Of the Group B1 assemblages from fieldhouses, most (31 of the 41) fell into the same three clusters (6, 10, and 17) as did the assemblages from trash mound deposits, suggesting that at least some of the fieldhouses were used similarly to large structural sites, those which have been interpreted to represent the loci of redundant, if not habitation activities. The same is true of the ledgerooms and those fieldhouses positively associated with water control features. But, assemblage Groups A and D, both with lower percentages of plainware jars, are better represented among these three site types than among any of the large structure site types.
¶ 156 Nonstructural sites have lower percentages of assemblages falling into Group B1 than structural sites (except pithouses), although a majority still fall into Group B1. One exception to this is for hearths, where a larger percentage were classified as Group B2. As with the small structure site types, nonstructural site types show a greater amount of variety in the assemblage groups represented.
¶ 157 The distribution of assemblage groups by feature types (Table 4.38) is in many ways a more reliable indicator of “site” structure because they indicate the features most definitely associated with the assemblages being considered. As the table shows, there is slightly greater correspondence of the assemblage groups with feature types. But the sample sizes are small for some features, and as with the site type data, there are only a few clear-cut correspondences of feature types with assemblage groups. Despite these drawbacks, the patterns of association of some feature types with particular ceramic assemblage groups warrant further inquiry.
|
Table 4.38. Frequency of assemblages in functional groups by feature types. |
|||||||||||
|---|---|---|---|---|---|---|---|---|---|---|---|
| Ceramic Assemblage Group | |||||||||||
| A | B1 | B2 | C | D | |||||||
| Site Type | No. | % | No. | % | No. | % | No. | % | No. | % | Total |
| Chacoan Structure | - | - | 13 | 86.67 | 2 | 13.33 | - | - | - | - | 15 |
| Great Kiva | - | - | 1 | 50.00 | - | - | - | - | 1 | 50.00 | 2 |
| Kiva | - | - | 1 | 100.0 | - | - | - | - | - | - | 1 |
| Roomblock | 2 | 1.31 | 107 | 69.93 | 30 | 19.61 | 2 | 1.31 | 12 | 7.84 | 153 |
| Pithouse | - | - | 7 | 17.50 | 32 | 80.00 | - | - | 1 | 2.50 | 40 |
| Ledgeroom | - | - | 14 | 87.50 | 1 | 6.25 | - | - | 1 | 6.25 | 16 |
| Fieldhouse | 5 | 6.67 | 41 | 54.67 | 20 | 26.67 | 2 | 2.67 | 7 | 9.33 | 75 |
| Fieldhouse/Water Control | 1 | 33.33 | 1 | 33.33 | 1 | 33.33 | - | - | - | - | 3 |
| Rock Shelter | - | - | 1 | 100.0 | - | - | - | - | - | - | 1 |
| Unknown Structure | 1 | 8.33 | 5 | 41.67 | 4 | 33.33 | - | - | 2 | 16.67 | 12 |
| Storage Room | - | - | 1 | 33.33 | 1 | 33.33 | - | - | 1 | 33.33 | 3 |
| Cist | - | - | 2 | 100.0 | - | - | - | - | - | - | 2 |
| Water Control Feature | 3 | 33.33 | 5 | 55.56 | 1 | 11.11 | - | - | - | - | 9 |
| Hearth | 1 | 11.11 | 5 | 55.55 | 2 | 22.22 | 1 | 11.11 | - | - | 9 |
| Baking Pit | - | - | 3 | 30.00 | 7 | 70.00 | - | - | - | - | 10 |
| Fire Cracked Rock | 1 | 16.67 | 3 | 50.00 | 2 | 33.33 | - | - | - | - | 6 |
| Roads/Trails | 1 | 20.00 | 4 | 80.00 | - | - | - | - | - | - | 5 |
| Sherd Scatter | 7 | 11.67 | 30 | 50.00 | 16 | 26.67 | 1 | 1.67 | 6 | 10.00 | 60 |
| Sherd/Lithic Scatter | 1 | 2.63 | 24 | 63.16 | 11 | 28.95 | 1 | 2.63 | 1 | 2.63 | 38 |
| General Scatter | 5 | 8.06 | 28 | 45.16 | 25 | 40.32 | 1 | 1.61 | 3 | 4.84 | 62 |
| Other/Unknown | 2 | 16.67 | 4 | 33.33 | 5 | 41.67 | 1 | 8.33 | - | - | 12 |
| TOTAL | 30 | 300 | 160 | 9 | 35 | 534 | |||||
¶ 158 For example, as with the site type data, most of the large structural sites (excluding pithouses) tend to be associated with ceramic assemblage Group B1, the assemblage group most likely to indicate habitation. Because of the high percentage of ledgeroom assemblages in Group B1, these features may also be proposed to have been used for habitation. By contrast, features classified as fieldhouses do not show this homogeneity. Only about one-half of the assemblages from fieldhouses were placed in Group B1. Because the feature of “fieldhouse” refers to all structures of one or two rooms, it seems likely that further subdivision of this feature type (and its derivative site type) by number of rooms would provide an interesting comparison to the assignments based on ceramic assemblage content. One room masonry structures might be expected to have different ceramic assemblages than two room structures, and it may be sites of the latter size which comprise the majority of Group B1 assemblages within the fieldhouse site or feature type.
¶ 159 Baking pits have the lowest proportion of Group B1 assemblages and one of the highest proportions of Group B2 assemblages. Group B2 assemblages, consisting of over 80 percent plainware jars, might be expected at such features because these are presumed to represent the remains of some sort of plant processing facility. Given the ubiquity of baking pits in some areas, particularly Chacra Mesa, and the low number of assemblages with 20 or more sherds associated with them, it does not appear that large numbers of ceramic vessels were necessary for activities conducted at these facilities. But the consistent association of plainware jars with these features suggests patterned activities. It might be suggested that the plainware jars were being used to store the materials being processed in the baking pits, either before processing, after, or both. A relatively low breakage rate may be responsible for the low frequencies even though ceramic vessels were present in most cases.
¶ 160 Assemblages within the feature types of sherd scatters and sherd/lithic scatters show some slight, yet interesting contrasts with each other. Sherd/lithic scatters have slightly more assemblages that fall into Group B1. The addition of lithics to an assemblage suggests a wider range of activities, and it is also probable that at least some of these sherd and lithic scatters with Group B1 ceramic assemblages contain buried features. Sherd scatters have higher proportions of both Groups A and D. The former contains greater than 50 percent decorated jars while the latter has approximately equal proportions of all three ceramic classes. Other than fieldhouses and general scatters, sherd scatters have the highest number of Group A assemblages of any of the feature types. As Sebastian’s (1983b) literature search shows, assemblages with high proportions of decorated jars are probably indicative of day use only. They do not suggest habitation over an extended period of time because cooking vessels are absent or present in low frequencies. The seven sherd scatters with Group A assemblages might reasonably be grouped with the six fieldhouses (including one field house/water control) with the same assemblage group as areas used for short durations, but repetitively.
¶ 161 Sherd scatters with Group D assemblages suggest a wider range of activities, at least those activities involving ceramic containers. These assemblages are somewhat enigmatic because they do not have the clear pattern of either assemblages associated with clear-cut habitation, or a predominance of any single ceramic vessel class. The presence of plainware jars, at least some of which were probably used for cooking, suggests some domestic activities.
Temporal Distribution of Assemblage Groups
¶ 162 The identified functional groups of assemblages are not distributed homogeneously among the five date groups (Table 4.39). Group A assemblages—those probably resulting from day or relatively short term use—are absent from the earliest time period, and have their highest percentages in the A.D. 890 to 1025 and 1030 to 1130 periods. Group B1 assemblages, those identified as habitation related are also low in the earliest period, but increase rapidly after A.D. 700. As with Group A, Group B1 assemblages are most common in the A.D. 1030 to 1130 period. By contrast, Group B2 assemblages are present in the highest proportions during the earliest time period of A.D. 550 to 750. These assemblages then decrease in percentage during each subsequent period, but increase again slightly during the A.D. 1130 to 1230 period. While the high proportion of Group B2 assemblages during the earliest time period is not surprising, it is interesting to see continued use of these assemblages throughout the occupational sequence.
|
Table 4.39. Frequency of assemblages in functional groups by date group. |
|||||||||||
|---|---|---|---|---|---|---|---|---|---|---|---|
| Ceramic Assemblage Group | |||||||||||
| A | B1 | B2 | C | D | |||||||
| Date Group | No. | % | No. | % | No. | % | No. | % | No. | % | Total |
| 550-750 | - | - | 10 | 13.70 | 62 | 84.93 | 1 | 1.37 | - | - | 73 |
| 700-880 | 1 | 2.08 | 14 | 29.17 | 32 | 66.67 | - | - | 1 | 2.08 | 48 |
| 890-1025 | 8 | 8.16 | 65 | 66.33 | 21 | 21.43 | - | - | 4 | 4.08 | 98 |
| 1030-1130 | 13 | 6.53 | 147 | 73.87 | 14 | 7.04 | 4 | 2.01 | 21 | 10.55 | 199 |
| 1130-1230 | - | - | 19 | 55.58 | 4 | 11.76 | 3 | 8.82 | 8 | 23.53 | 34 |
| Unknowna | 8 | 9.76 | 45 | 54.88 | 27 | 32.93 | 1 | 1.22 | 1 | 1.22 | 82 |
| TOTAL | 30 | 300 | 160 | 9 | 35 | 534 | |||||
| aAlso includes all sites with date ranges longer than 200 years. | |||||||||||
¶ 163 Group C assemblages are rare throughout all time periods, but are most common during the two most recent periods. Group D assemblages are also rare in the earliest time periods. These assemblages are found after A.D. 890, and increase proportionately through the remainder of the Anasazi occupation of the areas.
¶ 164 The above temporal distribution indicates that there is an increase in functional diversity of assemblages through time. If we consider variety alone (the number of assemblage groups), the A.D. 550 to 750 period may be separated from the others as having the lowest number of functional groups. The A.D. 700 to 880 and 890 to 1025 date groups have similar variety, with the remaining two groups spanning the period of A.D. 1030 to 1230 being the most diverse. Based on the distribution of groups within each of the time periods, it appears that there is increasing functional differentiation among the sites through time.
Spatial Distribution of Assemblage Groups
¶ 165 Differences in the use of the four survey areas might be expected based, in part, on their different environmental resources. But are these differences reflected in the distribution of the functional assemblage groups of ceramics? In order to address this question, both temporal and spatial parameters were controlled and the cumulative percentage of ceramic assemblage groups plotted (Figure 4.17a-e). For all date groups, except the last (A.D. 1130-1230), the five plots are very similar. Some differences are present, however, and these differences appear to increase directionally with time.
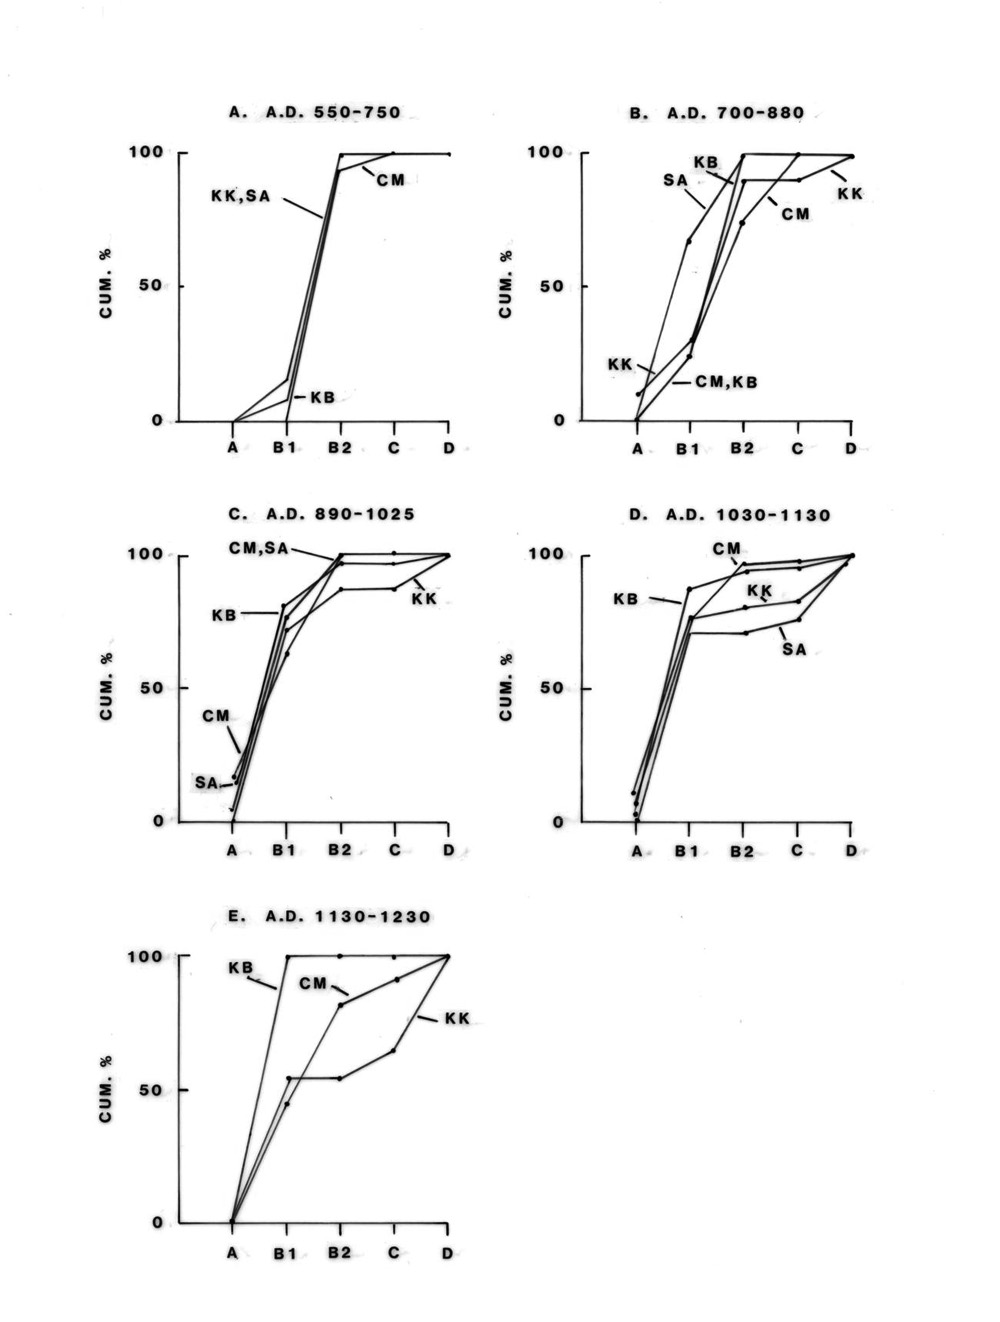 |
Figure 4.17a-e. Cumulative percentages of ceramic assemblage groups for each survey area by date group. |
¶ 166 During the period of A.D. 1030 to 1130, the first real differentiation among the areas is evident. Kin Bineola continues to have the highest proportion of Group B1 assemblages, while Chacra Mesa has the highest proportion of Group B2 assemblages. The areas also seem to fall into two groups with respect to the proportions of the other assemblage groups, which interestingly are not along the line of the two outlier (Kin Bineola and Kin Klizhin) versus non-outlier (Chacra Mesa and South Addition) areas. Instead, Chacra Mesa and Kin Bineola are more similar in that both have low proportions of assemblages in Groups C or D. By contrast, Kin Klizhin and the South Addition have relatively higher percentages of Group D assemblages. Thus, during this time period, Kin Bineola has the largest proportion of assemblages produced through habitation activities.
¶ 167 During the final time period considered, the South Addition does not have any dated assemblages. The other three areas, however, show the same trends as the previous time period, but more distinctly. The sample size of assemblages from Kin Bineola is very small during this period, but the cumulative percentage graph has the same shape as the previous period. Chacra Mesa again has the highest proportion of Group B2 assemblages, consisting of high percentages of plainware jars. Kin Klizhin has no Group B2 assemblages during this time period, but as with the previous time period, Group D assemblages are proportionately high. Thus, while the proportion of assemblages interpreted to represent habitation activities (B1) are almost identical between the two areas of Chacra Mesa and Kin Klizhin, Chacra Mesa has a larger proportion of assemblages with high percentages of plain jars (B2), while Kin Klizhin has a larger proportion of assemblages with decorated bowls © and assemblages without a clear dominance of any vessel type (D).
Summary and Evaluation of Functional Analysis
¶ 168 The above analysis of ceramic assemblage content suggests that there is some patterned variability among the ceramic assemblages from the four survey areas which may be attributed to differences in activities related to ceramic vessel use, if not in the use of sites. The major results may be summarized as follows:
1) The trash mound deposits were found to exhibit strong patterns of covariation with one particular assemblage group (B1). The clusters within Group B1 which were associated with trash mound deposits indicate a relatively narrow range of proportions for each of the three functional ceramic classes; from 17-28 percent decorated jars, 54-70 percent plain jars, and 10-18 percent decorated bowls. The same ranges were also found for many of the proveniences associated with surface architectural remains of more than three rooms, particularly those designated as Chaco structures, great kivas, and roomblocks. These ranges were interpreted as those resulting from repeated use for habitation related activities. The CV values for the general category of large structural sites were the lowest of any of the other site types, indicating that there is less variation within this general class.
2) Many of the small structural sites also had assemblages from Group B1, those interpreted to be the result of habitation activities. This suggested that the category of small structures includes some sites and/or proveniences which were used similarly to the larger structural sites. This finding is not surprising because the only difference between large and small structural sites is in the number of rooms, and the two room cutoff for the small sites was somewhat arbitrarily decided upon prior to the initiation of fieldwork. CV values for small structural sites were intermediary between those for the large structural sites and the nonstructural sites.
3) Nonstructural sites, although the sample sizes are approximately the same as for small structural sites, have fewer proveniences with Group B1 assemblages, and greater percentages of proveniences assigned to the other assemblage groups. The CV values for these assemblages were also much higher, suggesting that greater variation is present.
¶ 169 Thus, there is a trend from low to high assemblage variability corresponding to high to low investment in facilities. The sites with the greatest investment in facilities, those designated as Chacoan structures, have the lowest amount of assemblage variability. Great kivas and sites with more than three contiguous rooms also have high investment in facilities, and correlatively lower amounts of assemblage variability. The sites with no visible investment in facilities, the artifact scatters, display the most assemblage variability.
¶ 170 Why should this pattern be so? In some ways it is counterintuitive. One might expect greater variability at the large structural sites because of the greater number of activities which probably occurred there, and the narrower ranges of variability at so-called “limited activity” sites. It is not the range of activities which produces assemblage variability, however, but differences in the rates of failure (i.e., breakage) of ceramics. If the breakage rates are stable, as they probably are for redundant activities, it does not matter that there is a diversity of activities occurring at a site. Occupations at the large structural sites involved complex yet redundant activity structures, resulting in relatively narrow ranges of variability in the functionally sensitive ceramic proportions.
¶ 171 Assuming no change in the use of ceramic raw materials, ceramic use-life is a constant for a given activity, and there is logically only one way that different proportions of ceramic classes can result: through their use in different activities. In fact, however, there is at least one additional factor to consider. Stability in ceramic proportions does not happen all at once even with redundant activities (Mills 1989). Because use-lives for different vessel classes are unequal, it takes a certain amount of time for the proportions to stabilize. That the proportions do in fact stabilize is illustrated by the narrow range of proportions found within trash mound deposits. Thus, short duration habitation sites, even if they involve the exact same range of activities as at long occupied habitation sites, may have different proportions of ceramic use classes. The length of time needed for the proportions to stabilize will depend on the disparity in the use-lives of the classes being monitored. Sites occupied for short durations may therefore have highly variable proportional classes, as will sites used for different, nonredundant activities.
¶ 172 This contrast in the amount of variation present among sites used for different purposes within the same settlement system has been predicted at a more theoretical level by Binford (1980). He distinguishes between coarse-grained sites (those with multiple activity structures) and fine-grained sites (those used for a limited number of activities). With increasing sedentism, residential sites are seen as becoming increasingly more coarse-grained. Limited activity sites, on the other hand, are fine-grained in that their assemblage composition may be more directly related to the actual activities performed. Thus, Binford predicts that coarse-grained sites within a particular settlement system will be less variable as a class of sites, while the fine-grained, limited activity sites will be more variable. This appears to be the process occurring within both the current data from the San Juan Basin reported on in this chapter, as well as the data reported on by Camilli (1988) from the Quemado area. The CV values for Chaco structures, followed by great kivas and roomblocks are lower than those of the other site types, indicating that there is less variation within these types.
¶ 173 In conclusion, the general hypothesis that there is some covariation between ceramic assemblage variables and other variables of site content appears to be confirmed, but the amount of covariation present was found to be uneven among settlement types. The major reason for this lack of congruence within certain site types appears to be the presence of differential assemblage formation processes. Some of the variables contributing to differences in assemblage formation were identified. Future work on this problem should include more theoretical modeling of assemblage formation under different kinds of activity structures, in addition to the refinement of ceramic assemblage and site variables. One problem with the above analysis is that Group B1 is numerically a very large ceramic assemblage group. It may be possible in the future to further subdivide this group using data such as orifice diameter measurements (not available for the present project). This would allow further discrimination of functionally sensitive ceramic assemblage classes and potentially further discrimination of the use of sites using ceramic data.
Summary and Conclusions
¶ 174 Based on morphological similarities with structures in central Chaco Canyon, and the presence of substantial road networks, Chacoan outliers have been recognized to be part of an extensive regional system. The nature of this interaction of Chacoan outliers with their surrounding communities, the central Chaco Canyon sites, and the rest of the Chacoan regional system is a question of current archeological concern. The present project has afforded an opportunity to further investigate some of these relationships at both the intra-community and inter-community level. This chapter has concentrated on patterning among the survey ceramic assemblages with respect to temporal and spatial distribution, evidence for trade and exchange, and the identification of functional differences based on ceramic assemblage content. In the remainder of this chapter, these patterns are summarized in three ways: 1) by comparing the Chacoan structures of Kin Bineola and Kin Klizhin with sites in their respective communities, 2) by contrasting the two survey areas containing Chacoan outlier communities (Kin Klizhin and Kin Bineola) with the two non-outlier areas (Chacra Mesa and the South Addition), and 3) by contrasting all four of the survey areas with sites in Chaco Canyon and with other Chacoan outliers in the San Juan Basin. Comparisons made to Chaco Canyon are unfortunately of a limited nature due to the lack of data comparable to that recorded during the present project. The early surveys of Chaco Canyon (Hayes et al. 1981) included only grab samples of ceramics and have only been reported on with respect to traditional ceramic taxonomies. Resurvey of some of the central canyon sites by Windes (Windes and Doleman 1985) was restricted to only one site type, structural sites of three rooms or more, and the ceramic data currently available do not include variables of production, distribution, or ceramic function—the major concerns of this chapter.
Intra-Community Comparisons
¶ 175 Considering first only the two outlier communities, the Chacoan structure of Kin Bineola is clearly earlier than that of Kin Klizhin. Four of the five features sampled at Kin Bineola have date ranges which begin in the A.D. 900s, and only one extends beyond A.D. 1100. By contrast, all four of the features sampled at Kin Klizhin were dated to approximately A.D. 1050-1175.1Although the Kin Klizhin Chacoan structure was assigned to the A.D. 1030-1130 (DG 400) date group by the clustering analysis, a date range of A.D. 1050-1175 is indicated by the ceramic assemblage, suggesting that some use of the structure may have occurred after 1130. The difference in the timing of occupation of the two Chacoan structures is reflected in temporal differences in the number of sites within their respective communities. Kin Bineola has nearly twice as many “habitation” sites as Kin Klizhin during the first two periods, but by the A.D. 890 to 1025 period, Kin Klizhin begins to show substantial increases in the frequencies of these sites (see Table 4.31; compare Figures 2.12-2.14 with Figures 2.20-2.22). During the last period of A.D. 1130 to 1230, in which the Chacoan structure of Kin Bineola was apparently little used, both Kin Klizhin and its community still show continued substantial use (compare Figure 2.16 with Figure 2.24).
¶ 176 In terms of the relative frequencies of nonlocal ceramics, particularly trachyte-tempered ceramics, the two Chacoan structures appear very similar. The Kin Klizhin Chacoan structure has a mean percentage of Chuskan ceramics of 14.46 percent (Table 4.32), and a mean percentage of all nonlocal ceramics of 20.16 percent (Table 4.28), while Kin Bineola (29SJ 1580) has a mean percentage of Chuskan ceramics of 16.04 percent (Table 4.32), and a total nonlocal ceramic percent of 18.46. But if the percentages of nonlocal ceramics at the Chacoan structures are compared with those sites classified as large structures within their respective areas, there are distinctive differences between the two communities. The percentages of Chuskan and nonlocal ceramics noted above at the Kin Bineola Chaco structure (29SJ 1580) are nearly twice as high as the percentages for Chuskan ceramics and total nonlocal ceramics at large structures within the surrounding community (Table 4.28). During the time periods of A.D. 890 to 1025 and 1030 to 1130 contemporaneous with the use of the Kin Bineola structure, the mean proportions of trachyte-tempered ceramics at large structures are less than 9 percent (Table 4.31) and the mean proportions of total nonlocal ceramics are less than 12 percent. By contrast, for the A.D. 1030-1130 time period, contemporaneous with the occupation of the Kin Klizhin structure, the mean percentage of trachyte at large structures is 13.65 percent (Table 4.31) and the mean percentage of nonlocal ceramics is 20.34 percent – very similar to the proportions noted above for the Chacoan structure itself. The subsequent period of A.D. 1130 to 1230 shows only a small drop in the percentages of trachyte tempered ceramics at large structures within the Kin Klizhin area. Thus, greater differentiation between the central site and surrounding community is present in the Kin Bineola area than in the Kin Klizhin area.
¶ 177 Spatial propinquity to a Chacoan structure or great kiva appears to have little relationship to the proportion of nonlocal ceramics within an assemblage. The regression analyses demonstrated that very little of the variation in the distribution of nonlocal ceramics among habitation sites was explained by distance to a contemporaneous Chacoan structure and/or great kiva. In fact, the strongest relationship between these two variables was the opposite of that expected; during the A.D. 890 to 1025 period, as distance from the great kiva site of 29Mc 261 within the Kin Bineola survey area increased, the proportion of trachyte and total nonlocal ceramics within assemblages increased. The strongest relationship between these two variables in the direction predicted was during the same time period at Kin Bineola, relative to distance from the Chacoan structure of Kin Bineola itself (29SJ 1580). The substantially larger size of this structure over the Chacoan structure at Kin Klizhin is probably important in this regard.
¶ 178 Functional differentiation among the ceramic assemblages within the two outlier communities is also present. The Kin Bineola area has proportionately more assemblages that were classified as assemblage Group B1, the probable product of habitation activities, than the Kin Klizhin area. This trend is evident beginning in the A.D. 890 to 1025 period, and becomes more pronounced through time. The Kin Klizhin area has proportionately more assemblages that were assigned to Groups C and D, which may represent the result of day use, seasonal, and/or short duration activities. Despite these differences between communities, all of the proveniences sampled at the two Chacoan structures themselves or at other features of public architecture within each area, were functionally identical. With a few exceptions, all of these assemblages fell into Group B1, the group typical of nearly all trash mound proveniences, whether associated with public architecture or not.
Comparison of Outlier and Non-outlier Areas
¶ 179 Despite the assemblage differences noted between the Kin Klizhin and Kin Bineola survey areas, the fact that they are neighboring outlier communities makes it reasonable to propose that the two areas might be more similar to each other than to the Chacra Mesa and South Addition survey areas. With respect to the distribution of nonlocal ceramics, this is not consistently true (Table 4.27). The percentage of all nonlocal ceramics through time showed that it is only during the initial ceramic period of A.D. 550 to 750 in which the two outliers have more similar ceramic frequencies to each other than to the two non-outlier survey areas. During the last two ceramic periods (A.D. 1030 to 1130), the Kin Klizhin area has more similar percentages to the Chacra Mesa area than to the Kin Bineola area.
¶ 180 The Kin Klizhin area shows differentiation from all three of the other survey areas with respect to the percentage of nonlocal graywares (i.e., Chuska Gray Ware) within each date group. While all four areas have essentially the same patterns through time, the survey area of Kin Klizhin, with the exception of the first period, is consistently higher than the rest.
¶ 181 Nonlocal painted ware distributions between the two outlier communities are most similar during the first and third time periods (Figure 4.7). During the remaining periods one or the other of the two outliers is more similar to either Chacra Mesa or the South Addition. During the A.D. 1130-1230 period Kin Klizhin and Chacra Mesa are more similar in having the highest percentages of nonlocal painted wares.
¶ 182 However, this pattern does not apply to the distribution of Chuska White Ware (Figure 4.8). This ware is present in low percentages in all four areas through all time periods, except for the A.D. 700 to 880 period, when the South Addition has aberrantly high percentages. The extreme differentiation of the South Addition suggests that a problem in recording consistency may be present, but the narrow temporal bounds of this inconsistency is puzzling.
¶ 183 The proportion of nonlocal gray ware and nonlocal painted wares at specific site type groups indicates differences between the two outlier communities versus the other two survey areas (Figures 4.9a and 4.9b). Chuska Gray Ware is present in higher percentages at the site type groups of Chacoan structures, large structures and small structure sites within the two outliers, but not at sites without structures. Whether distance to the source of Chuska Gray Ware alone is responsible for these differences, or whether other social aspects of distribution are present is difficult to evaluate with the current data. The distribution of nonlocal painted wares does not show the same contrasts among the four survey areas. In this case, Chacra Mesa and Kin Klizhin area sites within all four site type groups have the highest percentages. On the basis of this differential spatial distribution of nonlocal painted versus plainwares, it is suggested that the systems of distribution of these two general ware categories were different.
¶ 184 Differences are also evident among outlier and non-outlier survey areas in ceramic groups inferred to represent functional variability among assemblages. Analysis of patterns through the five time periods revealed that the two outlier communities were more different from each other than to the other two survey areas for at least the last two time periods of A.D. 1030 to 1230 (Figure 4.17). During this temporal range, the Kin Bineola area had more assemblages classified as those typical of habitation sites, while the Kin Klizhin and South Addition (A.D. 1030-1130 only) areas had more nonhabitation sites. Chacra Mesa falls between these extremes, with lower percentages of habitation assemblages than Kin Bineola, and lower percentages of nonhabitation assemblages than Kin Klizhin and the South Addition.
¶ 185 Thus, based both on evidence from ceramic ware distributions and functional assemblage differentiation, there is no consistent contrast between the outlier and non-outlier survey areas. Variability between the two outliers is often greater than variability between the outlier and non-outlier survey areas. Reconstruction of the Chaco regional system must take this into account.
The Survey Areas in Regional Perspective
¶ 186 In this chapter comparisons at the regional level were primarily with respect to patterns of production and distribution. Using ware categories as evidence of the representation of different areas of production, it was shown that the people using the survey areas had a wide network of interaction. Greater interaction through time with the Chuska area than any other area was present, based on the generally increasing proportions of Chuskan wares through the five date groups. Interaction with the Tusayan area was apparently more common during the earliest time periods, while interaction with areas to the north, where the Mesa Verde White Ware was produced, appears to have been more prevalent during the latest time periods (Table 4.27).
¶ 187 Comparisons were made between large structural sites of the survey areas and excavated village sites within Chaco Canyon (Table 4.31). Chaco Canyon village sites were found to have had lower percentages of trachyte-tempered ceramics than sites within most of the other survey areas during the A.D. 550 to 750 period, but throughout the remaining time periods, Chaco Canyon sites had higher percentages of trachyte-tempered ceramics.
¶ 188 The pattern of higher percentages of trachyte tempered ceramics at Chaco Canyon sites was also found to be true in a distance-decay model comparison of trachyte tempered ceramics at Chacoan structures and great kivas throughout the San Juan Basin. During the first period investigated for this analysis, A.D. 890 to 1025, sites of these types within the Kin Bineola area had lower percentages than might be expected from a simple distance-decay model, particularly the site of 29Mc 261. During the subsequent A.D. 1030 to 1130 period, the Chacoan structures and great kiva sites within the survey area better fit with the distance-decay model, and in a few cases were slightly higher than might be expected. During this time period, it was suggested that the survey areas appear to be part of the pattern described by Doyel et al. (1984) for sites on the periphery of what they term the “Chaco Halo.” The last time period of A.D. 1130 to 1230 was seen to have a dramatic decrease in the number of sites identified as Chacoan outliers, with most of the survey area sites having trachyte in expectable percentages given their distance to the Chuskas. Thus, even though the survey areas fall within a distance of 20 km from “downtown” Chaco Canyon, the aberrantly high proportion of trachyte-tempered ceramics found within Chaco was not found within the survey areas. The size of the “Chaco Halo,” as it were, appears to have had a radius of only about 10 km.
¶ 189 As discussed in the section of this chapter on patterns of distribution, the current data are not sufficient to evaluate the specific mode of distribution responsible for the high percentages of trachyte temper at sites so distant from their area of production. It was suggested that models incorporating either primary or secondary modes of distributions could be applied to the current data, and that test implications for each need to be generated for future application to the San Juan Basin data.
Acknowledgments
¶ 190 Many people offered advice and help during the preparation of this chapter. I have benefitted much from discussions with Cathy Cameron, Eileen Camilli, Steve Lekson, Mike Marshall, Peter McKenna, Bob Powers, Dusty Teaf, Wolky Toll, Gwinn Vivian, Tom Windes, and Lisa Young. Wolky Toll, Bob Powers, T. J. Ferguson, Peter McKenna, and Tom Windes offered many useful suggestions on an earlier draft of this chapter. Bob Powers is to be particularly thanked for his role as Project Director, and for making both fieldwork and analysis an enjoyable experience.
Notes
1 Although the Kin Klizhin Chacoan structure was assigned to the A.D. 1030-1130 (DG 400) date group by the clustering analysis, a date range of A.D. 1050-1175 is indicated by the ceramic assemblage, suggesting that some use of the structure may have occurred after 1130.
References
| Acklen, John C. | |||
| 1982 | Ceramic Analysis. In Anasazi and Navajo Land Use in the McKinley Mine Area Near Gallup, New Mexico. Volume One: Archeology, Part One, edited by Christina G. Allen and Ben A. Nelson, pp. 578-596. Office of Contract Archeology, University of New Mexico, Albuquerque. | ||
| Altschul, Jeffrey H. | |||
| 1978 | The Development of the Chacoan Interaction Sphere. Journal of Anthropological Research 34(1):109-146. | ||
| Arnold, Dean E. | |||
| 1978 | The Ethnography of Pottery Making in the Valley of Guatemala. In The Ceramics of Kaminaljuyu, edited by Ronald K. Wetherington, pp. 327-400. Pennsylvania State University Press, University Park. | ||
| ---- | |||
| 1985 | Ceramic Theory and Cultural Process. Cambridge University Press, New York. | ||
| Binford, Lewis R. | |||
| 1980 | Willow Smoke and Dogs’ Tails: Hunter-Gatherer Settlement Systems and Archaeological Site Formation. American Antiquity 45(1):4-20. | ||
| Cameron, Catherine M. | |||
| 1984 | A Regional View of Chipped Stone Raw Material Use in Chaco Canyon. In Recent Research on Chaco Prehistory, edited by W. James Judge and John D. Schelberg, pp. 137-152. Reports of the Chaco Center, Number 8. Division of Cultural Research, National Park Service, Albuquerque. | ||
| Camilli, Eileen | |||
| 1988 | Settlement Components in the Moderate Production Area. In Archeological Investigations in West Central New Mexico, Volume 1: Report of the First Field Season, by Eileen Camilli, Dabney Ford, and Signa Larralde, pp 7-1 to 7-29. Cultural Resources Series No. 3, Bureau of Land Management, Socorro, New Mexico. | ||
| Doyel, David E., Cory D. Breternitz, and Michael P. Marshall | |||
| 1984 | Chacoan Community Structure: Bis sa'ani Pueblo and the Chaco Halo. In Recent Research on Chaco Prehistory, edited by W. James Judge and John D. Schelberg, pp. 37-54. Reports of the Chaco Center, Number 8. Division of Cultural Research, National Park Service, Albuquerque. | ||
| Dykeman, Douglas D., James K. Feathers, and Ronald H. Towner | |||
| 2003 | Tree Rings and Thermoluminescence: Chronology and Dating Issues of the Early Navajo Occupation. In The Morris Site 1 Early Navajo Land Use Study: Gobernador Phase Community Development in Northwestern New Mexico, Volume 2, edited by Douglas D. Dykeman, pp. 373-390. Navajo Nation Papers in Anthropology No. 39, Window Rock, Arizona. | ||
| Ford, Dabney | |||
| 1982 | Bis sa'ani Ceramics. In Bis sa'ani: A Late Bonito Phase Community on Escavada Wash, Northwest New Mexico, Volume 2, Part 1, edited by Cory Dale Breternitz, David E. Doyel, and Michael P. Marshall, pp. 359-414. Navajo Nation Papers in Anthropology No. 14. Navajo Nation Cultural Resource Management Program, Window Rock. | ||
| Franklin, Hayward H. | |||
| 1979a | Refiring of Culinary Wares from Salmon Ruin. In San Juan Valley Archaeological Resource Development Program: Final Report for the Four Corners Commission, 1978-1979, edited by Cynthia Irwin-Williams, unpaginated. Unpublished ms. on file, Salmon Ruins Library, Bloomfield, New Mexico. | ||
| ---- | |||
| 1979b | Refiring of Cibola and Chuska Whitewares from Salmon Ruin. In San Juan Valley Archaeological Resource Development Program: Final Report for the Four Corners Commission, 1978-1979, edited by Cynthia Irwin-Williams, unpaginated. Unpublished ms. on file, Salmon Ruins Library, Bloomfield, New Mexico. | ||
| ---- | |||
| 1979c | A Preliminary Refiring of Clays in the Vicinity of Salmon Ruin. In San Juan Valley Archaeological Resource Development Program: Final Report for the Four Corners Commission, 1978-1979, edited by Cynthia Irwin-Williams, unpaginated. Unpublished ms. on file, Salmon Ruins Library, Bloomfield, New Mexico. | ||
| Fry, Robert E. | |||
| 1980 | Models of Exchange for Major Shape Classes of Lowland Maya Pottery. In Models and Methods in Regional Exchange, edited by Robert E. Fry, pp. 3-18. SAA Papers No. 1. | ||
| Garrett, Elizabeth M., and Hayward H. Franklin | |||
| 1983 | Petrographic and Oxidation Analyses of NMAP Ceramics. In Economy and Interaction Along the Lower Chaco River: The Navajo Mine Archaeological Program, Mining Area III, San Juan County, New Mexico, edited by Patrick Hogan and Joseph C. Winter, pp. 311-320. Office of Contract Archeology and Maxwell Museum of Anthropology, University of New Mexico, Albuquerque. | ||
| Grayson, Donald K. | |||
| 1984 | Quantitative Zooarchaeology: Topics in the Analysis of Archaeological Faunas. Academic Press, New York. | ||
| Grebinger, Paul | |||
| 1973 | Prehistoric Social Organization in Chaco Canyon, New Mexico: An Alternative Reconstruction. The Kiva 39(1):3-23. | ||
| Hayes, Alden C., David M. Brugge, and W. James Judge | |||
| 1981 | Archeological Surveys of Chaco Canyon, New Mexico. Publications in Archeology 18A, Chaco Canyon Series, National Park Service, Washington, D. C. | ||
| Hodder, Ian | |||
| 1974 | Regression Analyses of Some Trade and Marketing Patterns. World Archaeology 6:172-189. | ||
| ---- | |||
| 1979 | Pottery Distributions: Service and Tribal Areas. In Pottery and the Archaeologist, edited by M. Millet, pp. 7-23. Institute of Archaeology Occasional Publication No. 4. University of London. | ||
| Howry, Jeffrey C. | |||
| 1978 | Ethnographic Realities of Mayan Prehistory. In Cultural Continuity in Mesoamerica, edited by David L. Browman, pp. 239-257. Mouton, The Hague. | ||
| Jones, George T., Donald K. Grayson, and Charlotte Beck | |||
| 1983 | Artifact Class Richness and Sample Size in Archaeological Surface Assemblages. In Lulu Linear Punctated: Essays in Honor of George Irving Quimby, edited by Robert C. Dunnell and Donald K. Grayson, pp. 55-73. Anthropological Papers of the Museum of Anthropology, No. 72. University of Michigan, Ann Arbor. | ||
| Judd, Neil M. | |||
| 1954 | The Material Culture of Pueblo Bonito. Smithsonian Miscellaneous Collections 124. Smithsonian Institution, Washington, D.C. | ||
| Judge, W. James | |||
| 1979 | The Development of a Complex Cultural Ecosystem in the Chaco Basin, New Mexico. In Proceedings of the First Conference of Scientific Research in the National Parks, Volume 2, edited by R. M. Linn, pp. 901-906. Transactions and Proceedings Series 5, National Park Service, Washington, D.C. | ||
| Judge, W. James, William B. Gillespie, Stephen H. Lekson, and H. Wolcott Toll | |||
| 1981 | Tenth Century Developments in Chaco Canyon. In Collected Papers in Honor of Erik Kellerman Reed, edited by Albert H. Schroeder, pp. 65-98. Papers of the Archeological Society of New Mexico 6. Santa Fe. | ||
| Kincaid, Chris, editor | |||
| 1983 | Chaco Roads Project, Phase I: A Reappraisal of Prehistoric Roads in the San Juan Basin. Bureau of Land Management, Albuquerque. | ||
| Lerner, Shereen | |||
| 1984 | Functional Interpretation of Black Mesa Ceramics. In Papers on the Archaeology of Black Mesa, Arizona, Volume II, edited by Stephen Plog and Shirley Powell, pp. 87-101. Southern Illinois University Press, Carbondale. | ||
| Loose, Richard W. | |||
| 1977 | Petrographic Notes on Selected Lithic and Ceramic Materials. In Settlement and Subsistence Along the Lower Chaco River: The CGP Survey, edited by Charles A. Reher, pp. 567-571. University of New Mexico Press, Albuquerque. | ||
| McKenna, Peter J. | |||
| 1985a | The Three Little Digs, Ceramic Clues to Intermittent Activity at 29SJ 721. Unpublished ms. on file, Chaco Culture National Historical Park Museum Archive, University of New Mexico, Albuquerque. | ||
| ---- | |||
| 1985b | Ceramics from the West Component Tests, 29SJ 626. Unpublished ms. on file, Chaco Culture National Historical Park Museum Archive, University of New Mexico, Albuquerque. | ||
| McKenna, Peter J., and H. Wolcott Toll | |||
| 1984 | Ceramics. In The Architecture and Material Culture of 29SJ 1360 by Peter J. McKenna, pp. 103-222. Reports of the Chaco Center, Number 7. Division of Cultural Research, National Park Service, Albuquerque. | ||
| Marshall, Michael P., John R. Stein, Richard W. Loose, and Judith E. Novotny | |||
| 1979 | Anasazi Communities of the San Juan Basin. Public Service Company of New Mexico, Albuquerque, and the Historic Preservation Bureau, Santa Fe. | ||
| Mills, Barbara J. | |||
| 1989 | Integrating Functional Analysis of Vessels and Sherds through Models of Ceramic Assemblage Formation. World Archaeology 21:133-147. | ||
| Mills, Barbara J., Andrea J. Carpenter, and William Grim | |||
| 1997 | Sourcing Chuskan Ceramic Production: Petrographic and Experimental Analyses. Kiva 62:261-282. | ||
| Peacock, D. P. S. | |||
| 1982 | Pottery in the Roman World: An Ethnoarchaeological Approach. Longman, London. | ||
| Peckham, Stewart | |||
| 1977 | Comments on the Chuska Ceramic Series. In Settlement and Subsistence Along the Lower Chaco River: The CGP Survey, edited by Charles A. Reher, p. 358. University of New Mexico Press, Albuquerque. | ||
| Pepoy, Renee C., and Laurance D. Linford | |||
| 1982 | Ceramic Analysis. In Kayenta Anasazi Archeology on Central Black Mesa, Northeastern Arizona, The Pinon Project, edited and assembled by Laurance D. Linford, pp. 245-280. Navajo Nation Papers in Anthropology No. 10. Navajo Nation Cultural Resource Management Program, Window Rock, Arizona. | ||
| Powers, Robert P. | |||
| 1984 | Regional Interaction in the San Juan Basin: The Chacoan Outlier System. In Recent Research on Chaco Prehistory, edited by W. James Judge and John D. Schelberg, pp. 23-36. Reports of the Chaco Center, Number 8. Division of Cultural Research, National Park Service, Albuquerque. | ||
| Powers, Robert P., William B. Gillespie, and Stephen H. Lekson | |||
| 1983 | The Outlier Survey: A Regional View of Settlement in the San Juan Basin. Reports of the Chaco Center, Number 3. Division of Cultural Research, National Park Service, Albuquerque. | ||
| Reina, Ruben E., and Robert M. Hill, III | |||
| 1978 | The Traditional Pottery of Guatemala. University of Texas Press, Austin. | ||
| Renfrew, Colin | |||
| 1975 | Trade as Action at a Distance: Questions of Integration and Communication. In Ancient Civilization and Trade, edited by Jeremy A. Sabloff and C. C. Lamberg-Karlovsky, pp. 3-59. A School of American Research Book, University of New Mexico Press, Albuquerque. | ||
| ---- | |||
| 1977 | Alternative Models for Exchange and Spatial Distribution. In Exchange Systems in Prehistory, edited by Timothy K. Earle and Jonathan E. Ericson, pp. 71-89. Academic Press, New York. | ||
| Robertson, Ben, Andrew Fowler, and Terry Banteah | |||
| 1983 | Ceramics. In Archaeological Investigations Between Manuelito Canyon and Whitewater Arroyo, Northwest New Mexico, Volume Two, edited by Roger Anyon, Susan M. Collins, and Kathryn H. Bennett, pp. 439-514. Zuni Archaeology Program Report No. 185. Pueblo of Zuni, New Mexico. | ||
| Rohn, Arthur H. | |||
| 1971 | Mug House, Mesa Verde National Park, Colorado. Archeological Research Series Number 7D, National Park Service, Washington, D.C. | ||
| SAS Institute, Inc. | |||
| 1982 | SAS User’s Guide: Statistics. SAS Institute, Inc., Cary, N.C. | ||
| Sebastian, Lynne | |||
| 1983a | Regional Interaction: The Puebloan Adaptation. In Economy and Interaction Along the Lower Chaco River: The Navajo Mine Archaeological Program, Mining Area III, San Juan County, New Mexico, edited by Patrick Hogan and Joseph C. Winter, pp. 445-452. Office of Contract Archeology and Maxwell Museum of Anthropology, University of New Mexico, Albuquerque. | ||
| ---- | |||
| 1983b | Anasazi Site Typology and Chronology. In Economy and Interaction Along the Lower Chaco River: The Navajo Mine Archaeological Program, Mining Area III, San Juan County, New Mexico, edited by Patrick Hogan and Joseph C. Winter, pp. 403-419. Office of Contract Archeology and Maxwell Museum of Anthropology, University of New Mexico, Albuquerque. | ||
| Shepard, Anna O. | |||
| 1939 | Appendix A: Technology of La Plata Pottery. In Archaeological Studies in the La Plata District, by Earl H. Morris, pp. 249-287. Carnegie Institution of Washington Publication No. 519. Washington, D.C. | ||
| Stein, John R., and Daisy F. Levine | |||
| 1983 | Appendix C: Documentation of Selected Sites Recorded During the Chaco Roads Project. In Chaco Roads Project, Phase I: A Reappraisal of Prehistoric Roads in the San Juan Basin, edited by Chris Kincaid, pp. C-1 to C-64. Bureau of Land Management, Albuquerque. | ||
| Thomas, David Hurst | |||
| 1976 | Figuring Anthropology: First Principles of Probability and Statistics. Holt, Rhinehart and Winston, New York. | ||
| Toll, H. Wolcott | |||
| 1981 | Ceramic Comparisons Concerning Redistribution in Chaco Canyon, New Mexico. In Production and Distribution: A Ceramic Viewpoint, edited by Hilary Howard and Elaine L. Morris, pp. 83-122. BAR International Series 120. Oxford. | ||
| ---- | |||
| 1984 | Trends in Ceramic Import and Distribution in Chaco Canyon. In Recent Research on Chacoan Prehistory, edited by W. James Judge and John D. Schelberg, pp. 115-135. Reports of the Chaco Center, Number 8. Division of Cultural Research, National Park Service, Albuquerque. | ||
| ---- | |||
| 1985 | Pottery, Production, Public Architecture, and the Chaco Anasazi System. Unpublished Ph.D. dissertation, Department of Anthropology, University of Colorado, Boulder. | ||
| Toll, H. Wolcott and Peter J. McKenna | |||
| 1981 | Ceramics of 628. Unpublished ms. on file, Chaco Culture National Historical Park Museum Archive, University of New Mexico, Albuquerque. | ||
| ---- | |||
| 1987 | The Ceramography of Pueblo Alto. In Investigations at the Pueblo Alto Complex, Chaco Canyon, New Mexico, 1975-1979. Volume III, Part 1. Artifactual and Biological Analyses, edited by Frances Joan Mathien and Thomas C. Windes, pp. 19-230. Publications in Archeology 18F, Chaco Canyon Studies. National Park Service, Santa Fe. | ||
| ---- | |||
| 1992 | The Rhetoric and the Ceramics: Discussion of Types, Functions, and Sources of the Ceramics of 29SJ 627. In Excavations at 29SJ 627, Chaco Canyon, New Mexico. Volume II. The Artifact Analyses, edited by Frances Joan Mathien, pp. 37-248. Reports of the Chaco Center, Number 11. National Park Service, Santa Fe. | ||
| ---- | |||
| 1993 | The Testimony of the Spadefoot Ceramics. In The Spadefoot Toad Site: Investigations at 29SJ 629, Chaco Canyon, New Mexico: Artifactual and Biological Analyses. Volume II, edited by Thomas C. Windes, pp. 15-134. Reports of the Chaco Center, Number 12. National Park Service, Santa Fe. | ||
| ---- | |||
| 1997 | Chaco Ceramics. In Ceramics, Lithics, and Ornaments of Chaco Canyon. Analyses of Artifacts from the Chaco Project 1971-1978. Volume I. Ceramics, edited by Frances Joan Mathien, pp. 17-530. Publications in Archeology 18G, Chaco Canyon Studies. National Park Service, Santa Fe. | ||
| Toll, H. Wolcott, Thomas C. Windes, and Peter J. McKenna | |||
| 1980 | Late Ceramic Patterns in Chaco Canyon: The Pragmatics of Modeling Ceramic Exchange. In Models and Methods in Regional Exchange , edited by Robert E. Fry, pp 95-117. SAA Papers1. | ||
| Vivian, Gordon R., and Tom W. Mathews | |||
| 1964 | Kin Kletso, a Pueblo III Community in Chaco Canyon, New Mexico. Southwest Parks and Monuments Association Technical Series 6(1): 1-115. Globe, AZ. | ||
| Vivian, R. Gwinn | |||
| 1970 | An Inquiry into Prehistoric Social Organization in Chaco Canyon, New Mexico. In Reconstructing Prehistoric Pueblo Societies, edited by William A. Longacre, pp. 59-83. A School of American Research Book. University of New Mexico Press, Albuquerque. | ||
| Voll, Charles B. | |||
| 1964 | BC 262—A Small Late 11th and Early 12th Century Farming Village in Chaco Canyon, New Mexico. Unpublished ms. on file, Chaco Culture National Historical Park Museum Archive (Archive 505), University of New Mexico, Albuquerque. | ||
| Warren, A. H. | |||
| 1967 | Petrographic Analyses of Pottery and Lithics. In An Archaeological Survey of the Chuska Valley and the Chaco Plateau, New Mexico, Part I: Natural Science Studies, by Arthur H. Harris, James Schoenwetter, and A. H. Warren, pp. 104-134. Museum of New Mexico Research Records No. 4. Santa Fe. | ||
| Whittlesey, Stephanie M. | |||
| 1974 | Identification of Imported Ceramics Through Functional Analysis of Attributes. The Kiva 40(1-2):101-112. | ||
| Wilson, Dean | |||
| 2006 | Refiring Analysis of San Juan Ceramics from Salmon Ruin. In Thirty-Five Years of Archaeological Research at Salmon Ruins, New Mexico, Volume Two: Ceramic Studies, edited by Paul F. Reed, pp. 545-551. Center for Desert Archaeology, Tucson, and Salmon Ruins Museum, Bloomfield, New Mexico. | ||
| Windes, Thomas C. | |||
| 1977 | Typology and Technology of Anasazi Ceramics. In Settlement and Subsistence Along the Lower Chaco River: The CGP Survey, edited by Charles A. Reher, pp. 279-370. University of New Mexico Press, Albuquerque. | ||
| ---- | |||
| 1982 | Lessons from the Chacoan Survey: The Pattern of Chacoan Trash Disposal. New Mexico Archaeological Council Newsletter 4(5-6):5-14. | ||
| Windes, Thomas C., and Catherine M. Cameron | |||
| 1981 | Chipped Stone and Ceramics Survey of Greenlee and Upper Kin Klizhin Ruins. Ms. on file, Chaco Culture National Historical Park Museum Archive, University of New Mexico, Albuquerque. | ||
| Windes, Thomas C., and William H. Doleman | |||
| 1985 | Small House Population Dynamics During the Bonito Phase in Chaco Canyon. Paper presented at the 50th Annual Meeting of the Society for American Archaeology, Denver. | ||
Appendices
Appendix 4.1: Ceramic Artifact Database Printout
¶ 191 Appendix 4.1 is a printout of the Chaco Additions Survey ceramic database, organized by survey area and site number. Because of its size the printout has been divided into two pdf files. Part 1, (http://www.chacoarchive.org/media/pdf/006534_Part1.pdf) includes the Kin Klizhin data and part of the Kin Bineola data (to site 29 Mc 295) while Part 2 (http://www.chacoarchive.org/media/pdf/006534_Part2.pdf) includes the remainder of the Kin Bineola data (continuing with 29 Mc 295) and all of the Chacra Mesa and South Addition ceramic data.
Appendix 4.2: Ceramic Classification and Dating.
¶ 192 The ceramic recording system used during the Chaco Culture Additions survey was designed to collect information needed for the chronological assessment of the recorded sites, for assessing their potential for future research, and for the investigation of a limited number of research questions. The largest portion of the form (Appendix 1.1) used in the field consists of a typological classification of the ceramic artifacts present within each site component. For the most part, this typological classification follows a taxonomic system of nomenclature. In addition, some temper and vessel form attributes were recorded to answer questions about ceramic exchange and site function. Since a non-collection procedure was implemented in the field, the number of attributes which could be recorded was limited. Those attributes which were recorded were chosen on the basis of their potential for ease and consistency in recording, as well as their potential to answer the research questions identified in the research design (Powers 1983).
¶ 193 This report describes the ceramic recording system used during the inventory survey. It stresses those characteristics of the ceramics which allow the differentiation of one ceramic type from another within the typological system and why some general categories were used in lieu of discrete typological assignments. As such, it is not a full ceramic description of each type encountered in the field. For more detailed descriptions of Chaco area ceramics, the reader is referred to Toll and McKenna (1997). In addition to a discussion of the recording format used, this report presents a seriation of the ceramic sites recorded during the CHCU inventory survey. The method of date assignment and the problems with its accuracy are discussed. Finally, suggestions for future research using the ceramic data are outlined.
Classification
¶ 194 As noted above, ceramics were recorded according to a typologically oriented taxonomic system and by two ceramic attributes. These two attributes will first be discussed, followed by the description of the typological system.
¶ 195 The two ceramic attributes recorded were ceramic form and temper type. Ceramic form (i.e., bowl, jar, or ladle) was recorded for all slipped and/or painted wares within the assemblages. Ceramic form was not recorded for the unslipped wares because of problems with determining formal differences among plain ware body sherds.
¶ 196 One of two temper types was recorded for all of the unslipped and/or unpainted wares. In addition, since temper type is one of the diagnostic criteria upon which the whiteware types are based, temper type data is available for some of these ceramic types as an added benefit of the typology. For example, all of the Chuska White Ware were identified on the basis of the presence of trachyte temper, Tusayan White Wares on the basis of sand temper, and most of the Cibola White Ware on the basis of the presence of sherd temper. The frequencies of sherds within the whitewares may therefore be used in comparing the relative frequencies of temper types within an assemblage.
¶ 197 The two temper types used during the field tabulations of unslipped and unpainted wares were trachyte and sand. These two were chosen because of their relative distinctiveness; they are in most cases easily recognizable without recourse to a hand lens and analyst consistency is usually high. It should be noted that the category of sand temper also includes some sherds which contain sherd mixed with sand temper and does not differentiate among the different kinds of sand temper noted elsewhere in Chaco area assemblages (e.g., Loose 1977; Toll and McKenna 1987; Toll et al 1980; Windes 1977). The distinction in temper type used here was designed primarily to contrast trachyte-tempered sherds with all others. The presence and amount of temper in the assemblages has potential significance for questions of trade and exchange, one of the primary research questions identified in the research design.
¶ 198 The typological system of ceramic classification used on the inventory survey is most similar to the “Rough Sort” system of classification used by the Chaco Project staff as the initial classification of excavated ceramics prior to the selection of samples for more fine-grained analyses. This “Rough Sort” contrasts with many of the typological distinctions which have been previously used on Chaco area ceramics in that many of the traditionally recognized types have been collapsed because of difficulties in differentiating types in a field situation. In addition, some of the more traditionally recognized types have been further broken down in an effort to record variability of potential chronological importance. The following is a description of the system used to classify Anasazi, Navajo, and historic Pueblo ceramics. Within each one of these categories, plain wares are discussed first followed by painted wares. A complete list of all of the wares and types identified and described below is presented in Table 1 of this appendix, along with their estimated dates of manufacture and the coding numbers assigned to each one in the computerized data base.
|
Appendix 4.2, Table 1. Ceramic classes identified during the Chaco Additions survey. |
||
|---|---|---|
| Coding No. | Type Name | Estimated Dates (A.D.) |
| ANASAZI PLAIN WARE | ||
| 01 | Lino Gray and Fugitive | 550 or 600-800 |
| 02 | Plain Gray | 550 or 600-1200 |
| 03 | Wide Neck-Banded | 750-900 |
| 04 | Narrow Neck-Banded | 850-1050 |
| 05 | Neck Corrugated | 950-1050 |
| 06 | Unidentified Corrugated | 900-1300 |
| 07 | PII Rims | 1000-1125 |
| 08 | PII-PIII Rims | 1000-1220 |
| 09 | PIII Rims | 1100-1220 |
| 10 | Other plainware | |
| ANASAZI PAINTED WARES | ||
| Cibola White Ware | ||
| 11 | BMIII-PI mineral-on-white | 575-900 |
| 12 | Red Mesa Black-on-white | 850 or 900-1125 |
| 13 | Escavada Black-on-white | 925-1125 |
| 14 | Puerco Black-on-white | 1000-1125 |
| 15 | Gallup Black-on-white | 1000-1125 |
| 16 | Chaco Black-on-white | 1050-1150 or 1200 |
| 17 | Chaco-McElmo Black-on-white | 1100-1175 |
| 18 | PII-PIII mineral-on-white | 875-1200 |
| 19 | Unidentified Cibola White Ware | 575-1200 |
| Chuska White Ware | ||
| 20 | Chuska BMIII-PI mineral-on-white | 600-900 |
| 21 | Chuska BMIII-PI carbon-on-white | 600-850 |
| 22 | Tunicha Black-on-white | 850-900 |
| 23 | Chuska Red Mesa design | 825-1000 |
| 24 | Chuska Black-on-white | 1000-1125 |
| 25 | Toadlena Black-on-white | 975-1125 |
| 26 | Crumbled House Black-on-white | 1150-1300 |
| 27 | Chuska carbon-on-white | 850-1125 |
| 28 | Unidentified Chuskan White Ware | 600-1300 |
| Tusayan White Ware | ||
| 29 | BMIII-PI carbon-on-white | 575-875 |
| 30 | Lino Black-on-gray | 575-875 |
| 31 | Kana’a Black-on-white | 725-825 |
| 32 | Sosi-Black Mesa Black-on-white | 900-1200 |
| 33 | Sosi Black-on-white | 1075-1200 |
| 34 | Black Mesa Black-on-white | 875-1130 |
| 35 | Tusayan carbon-on-white | 900-1200 |
| Mesa Verde White Ware | ||
| 36 | Mancos-Cortez Black-on-white | 900-1150 |
| 37 | Mancos Black-on-white | 900-1150 |
| 38 | Cortez Black-on-white | 900-1000 |
| 39 | McElmo Black-on-white | 1075-1275 |
| 40 | Mesa Verde Black-on-white | 1200-1300 |
| 41 | Unidentified Mesa Verde carbon-on-white | 900-1300 |
| White Mountain Red Ware | ||
| 43 | Puerco Black-on-red | 100-1200 |
| 44 | Wingate Black-on-red | 1050-1200 |
| 50 | Wingate Polychrome | 1125-1200 |
| 63 | St. Johns Black-on-red | 1200-1300 |
| 49 | St. Johns Polychrome | 1200-1300 |
| 45 | Unidentified White Mountain Red Ware | 1000-1300 |
| 55 | Unidentified White Mountain Red Ware polychrome | 1125-1300 |
| 46 | San Juan Red Ware | 700-1000 |
| 47 | Tsegi Orange Ware | |
| 72? | Cameron Polychrome | 1065-1150 |
| 51 | Citadel Polychrome | 1115-1200 |
| 72? | Tusayan Polychrome | 1100-1300 |
| MISCELLANEOUS PREHISTORIC WARES | ||
| 42 | Smudged brown ware | |
| 61 | Socorro Black-on-white | 1050-1275 |
| 62 | Sanostee Red-on-orange | 800-875 |
| 48 | Unidentified red ware | |
| NAVAJO PLAIN WARE | ||
| 56 | Dinetah Gray | 1700-1850* |
| 57 | Navajo Gray | 1800-1950 |
| 58 | Pinyon Gray | 1800-1950 |
| NAVAJO PAINTED WARE | ||
| 53 | Gobernador Polychrome | 1700-1800* |
| 59 | Navajo Painted | 1750-present |
| HISTORIC PUEBLO WARES | ||
| Keresan | ||
| 54 | Zia Polychrome | 1800-present |
| 54 | Santa Ana Polychrome | 1800-present |
| 54 | Unidentified Keresan polychrome | 1700-present |
| Zuni | ||
| 54 | Hawikuh Polychrome | 1600-1680 |
| 54 | Kiapkwa Polychrome | 1750-1850 |
| 54 | Zuni Polychrome | 1850-1935 |
| Hopi | ||
| 52 | Unidentified Hopi polychrome | |
| * As the result of recent excavations, Dinetah Gray (A.D. 1550-1800) and Governador Polychrome (A.D. 1640-1765 or 1775) are known to have been produced substantially earlier in the Dinetah area of the northern San Juan Basin (see Dykeman et al. 2003) than was thought when this chapter was prepared. | ||
Anasazi Plain Wares
Lino Gray and Fugitive Red
¶ 199 This category was used in order to distinguish the Basketmaker III/early Pueblo I plain wares from those dating to the late Pueblo I through Pueblo III periods. The classification of sherds into the Lino Gray/Fugitive Red category was based primarily on the presence of a very coarse (usually sand) temper, often protruding through the vessel surface. The surface of these sherds was often smoothed but rarely polished. Striations caused by temper particles dislodged during the smoothing process were also commonly present. Because coarse-tempered gray ware sherds may be produced by the breakage of the bodies of both neck banded and neck corrugated gray ware vessels, only rim sherds were placed in the category of Lino Gray. If enough of the rim was present to show that no neck banding or neck corrugation was present and if the distinctive coarse temper was present, a sherd was classified as Lino Gray. Although the form did not explicitly ask for it, vessel form was often recorded for this type based on rim morphology.
¶ 200 Coarse tempered gray ware rim and body sherds which showed evidence of having been slipped with a fugitive red slip or wash were also included within the Lino Gray/Fugitive Red category. In these cases, body sherds were included under the premise that none of the neck banded or neck corrugated vessels would have this fugitive red wash.
Plain Gray
¶ 201 Sherds classified as plain gray included any non-rim sherd without corrugations or neck banding. As noted above, only rim sherds of Lino Gray were classified as such and the plain gray category therefore also contains counts of body sherds of Lino Gray vessels, as well as body sherds of neck banded and neck corrugated vessels. This category must be regarded as a composite category and its utility for chronological assessments is therefore limited. Its main purpose is to preserve the analytical utility of the other plain ware categories both in terms of their value for chronological assessments and any other analyses using this data, such as density calculations.
Wide Neckbanded
¶ 202 Any rim or neck sherd which showed evidence of banding without corrugated relief was placed in either the wide or narrow neckbanded categories. Wide bands were not distinguished from narrow bands by measurement in the field, but rather by a subjective assessment of band width by the ceramic recorders. Generally, any bands wider than 1 to 2 centimeters were considered “wide” by the field ceramicists. In a more typologically oriented ceramic classification system, wide neckbanded gray ware sherds would be called Kana’a Gray if sand tempered or Sheep Springs Gray if trachyte-tempered. Kana’a Gray has been described as having coil widths of greater than 8 millimeters by Hayes (see McKenna 1981) and between 8 millimeters and 14 millimeters, or sometimes not more than 5 millimeters by Colton and Hargrave (1937). Sheep Springs Gray has been described as having coils of between 1.1 centimeters and 3.0 centimeters (Windes 1977). Variation is therefore present in the definition of this type as traditionally defined, as well as in the stylistic equivalent used during the present project. Although subjective, the distinction between wide and narrow neck-banding is still of utility for inferences on the relative dating of ceramic assemblages.
Narrow Neckbanded
¶ 203 As noted above the maximum width for narrow neckbanded sherds is 1 to 2 centimeters. Other than coil width, narrow neckbanded sherds resemble wide neckbanded sherds in all other respects. The traditional typological equivalents to narrow neckbanded are Tohatchi Gray (if sand tempered), and Tocito Gray, Gray Hills Banded, or Capt. Tom Corrugated (if trachyte-tempered).
Neck Corrugated
¶ 204 Sherds from neck corrugated vessels typically have very wide “exuberantly” indented corrugations in the area of the neck, ending at the juncture of the neck and the vessel body. The corrugated neck may be zoned, with portions of the neck having narrow bands of corrugations while the remainder of the neck has large, indented, often scalloped corrugations. Assignment of sherds to this category was made if the neck/body juncture was present and showed the absence of indented corrugations below the neck area. Sherds were also placed in this category if the corrugated coils were very wide and showed the distinctive scalloped indentation pattern. Typologically, this category is roughly equivalent to Coolidge or Exuberant Corrugated (in part) if sand tempered, and Newcomb Corrugated if trachyte-tempered.
Unidentified Corrugated
¶ 205 As with the Plain Gray category, the category of Unidentified Corrugated is a catchall category used to keep the integrity of all other corrugated categories. If a sherd could not be categorized as one of the neck corrugated types, or if it was a corrugated, non-rim sherd (categorization of rim sherds is discussed below), then it was placed in this category. Since rim and neck sherds are more diagnostic than are body sherds, this category contains a much higher frequency of the latter. In addition, since the amount of the vessel body covered with corrugations increases through time, this category generally includes sherds manufactured later than the body sherds tabulated within the Plain Gray category.
PII, PII-PIII, and PIII Rims
¶ 206 All rim sherds which were not one of the neck corrugated types were categorized as either “PII,” “PII-PIII,” or “PIII rims.” The distinction between the neck corrugated types and these three rim categories was made on the basis of the size and treatment of the corrugations. PII, PII-III, and PIII rims were more often indented corrugated than not, but these corrugations were never as exuberant as those found on neck corrugated sherds. If the corrugations were not indented, they tended to be thinner and flatter than the corrugations found on the neck corrugated vessels.
¶ 207 Subdivision of sherds into PII, PII-PIII, or PIII rims was made on the basis of the degree of rim eversion. All of these classes of rim forms apply only to jars; none of the neck-banded, neck-corrugated or corrugated vessels are found in bowl forms. As with the determination between wide and narrow neck-banding, the determination of the degree of eversion in the corrugated rims was somewhat subjective. PII rims are the least everted, most resembling the straight to slightly flaring rim forms of the neck-banded and neck-corrugated jars. PIII rims are the most everted, with the lip of the rim sometimes everted as much as 45 degrees or more from the vertical axis of the vessel. The category of “PII-PIII” refers to those rims exhibiting a degree of rim eversion falling somewhere in between PII and PIII rims and was more often used in the case where the determination of one of the other rim form categories could not be made with assurance.
¶ 208 The traditional typological equivalents of the three categories distinguished above are Chaco Corrugated for sherd and/or sand tempered sherds and Blue Shale Corrugated or Hunter Corrugated for sherds tempered with trachyte. As the descriptive name implies, the rim forms are temporally sequential. Because “PII-PIII rims” is a more subjective category, and was often used to reflect the indeterminacy of assignment to one of the other two categories, these rims may be dated anywhere within the total range of the other two forms.
Anasazi Painted Wares
Cibola White Ware
¶ 209 As many who have worked with Cibola White Ware have noted (e.g., Cibola White Ware Conference 1958; Sullivan and Hantman, editors 1984), the taxonomic criteria for distinguishing among the types of Cibola White Ware is far from clear. Fortunately, the Chaco Series (as separated by Colton, 1941), is probably one of the most clearly defined series within Cibola White Ware. The classification of types within the Chaco Series of Cibola White Ware discussed below follows the descriptions presented elsewhere by McKenna and Toll (1984), Toll and McKenna (1981, 1987, 1992, 1993, 1997) and for the most part, by Windes (1977, 1984). Except for the first category discussed below (BMIII-PI mineral-on-white), the main criteria for distinguishing Cibola White Ware from the other white wares are the presence of sherd temper (often used in conjunction with a variety of other aplastic materials) and usually, the use of a mineral-based black paint.
BMIII-PI Mineral-on-white
¶ 210 La Plata Black-on-white and White Mound Black-on-white were both subsumed within the general category of BMIII-PI mineral-on-white ceramics. Often, enough of the design was not present to determine which of these two types to classify a sherd as. If design attributes were sufficiently diagnostic, the typological assignment was noted. All sherds falling into this category have sand temper, rather than the sherd temper found within most of the other types in the Chaco Series of Cibola White Ware. Grains of sand temper often protrude through the surfaces of the sherds. These surfaces may or may not have a thin slip and are frequently unpolished.
Red Mesa Black-on-white
¶ 211 In contrast to the previous category, sherds classified as Red Mesa Black-on-white usually contain some crushed sherds, as well as sand temper. In addition, surface treatment and design were used to distinguish sherds of this type. Red Mesa sherds tend to have well-slipped bowl interiors and jar exteriors. The exterior of bowls may or may not be slipped. All slipped surfaces are usually well polished.
¶ 212 It should be noted that sherds which might be classified as Kiatuthlanna Black-on-white elsewhere in the area of distribution of Cibola White Wares were not differentiated here. Previous research has indicated that the attribute cluster distinguishing Kiatuthlanna does not appear to occur in the Chaco area (Toll and McKenna 1997). “Early” and “Late” styles of Red Mesa Black-on-white have, however, been distinguished, with the former style much the same as that found on Kiatuthlanna Black-on-white (see also Roberts 1927:144-158), but without the other technological attributes used to distinguish Kiatuthlanna from Red Mesa. For the purposes of consistency control, the Early and Late Red Mesa styles were not differentiated during the present project, although notes on the presence of one of the styles were made if the ceramic recorder was sufficiently certain of the stylistic assignment. Red Mesa Black-on-white designs often contain one or more of the following design elements: interlocking scrolls, solid triangles with pendant dots, squiggled hachure between two parallel framing lines, and nested chevrons executed in fine lines.
Escavada Black-on-white
¶ 213 Escavada Black-on-white is differentiated from the other Cibola White Ware types on the basis of both style and technology. Design elements used for identifying this type are solid triangles; stepped frets; checkerboards; broad, parallel lines; interlocking scrolls; and other elements commonly associated with the Sosi design style. In contrast to Red Mesa Black-on-white, Escavada Black-on-white tends to have a thinner application of white slip, little or no polish, and more boldly executed designs. In contrast to Gallup Black-on-white, hachure is rarely present. When hachure is present, it is generally used in conjunction with solid elements. In the case of very small sherds, this rare co-occurrence of solid with hatched designs might cause Escavada Black-on-white sherds to be misclassified as Gallup Black-on-white.
Puerco Black-on-white
¶ 214 Although Windes (1984) groups all sherds with solidly filled designs under “Escavada-Puerco,” the two types were separated during the inventory survey. Puerco Black-on-white was distinguished from Escavada Black-on-white on the basis of its more highly polished surface and thicker slip. Design elements are very similar to Escavada Black-on-white, although they tend to be executed more boldly. In addition, if hachure is used it tends to be parallel rather than oblique to the framing lines.
Gallup Black-on-white
¶ 215 This type is essentially the same as Escavada Black-on-white in surface treatment and paste composition, with some exceptions. As noted above, it is differentiated on the basis of the prevalent use of hachure, a characteristic of the Dogoszhi design style. This hachure is used as filler within what are essentially the same design elements as those found on Escavada Black-on-white sherds: triangles (both opposed and unopposed), parallel bands, and less frequently, interlocking scrolls. The hatched areas are usually diagonal with respect to the framing lines, but occasionally, may be parallel. In the latter case, Gallup Black-on-white was differentiated from Red Mesa Black-on-white on the basis of the smaller spacing of lines within the hatched areas and the use of a thinner, less well-polished slip. But the slip of Gallup Black-on-white is polished, in contrast to Escavada Black-on-white. Because of the infrequent use of solid elements on vessels otherwise exhibiting a Dogoszhi design style, Gallup Black-on-white may occasionally be misidentified as Late Red Mesa or Escavada Black-on-white. Because of the temporal overlap of the types, and the rareness of this ambiguity in stylistic differentiation, this is not thought to be a significant problem for the purposes of chronological control.
¶ 216 “Early” and “Late” styles of Gallup have been recognized (Toll and McKenna 1997). Early Gallup tends to have the tips of triangles solidly filled and wider spacing between hachure lines, while Late Gallup does not. If solid-tipped triangles were present, the ceramic recorders made a notation that Early Gallup style was present, even though it was not a formal category.
Chaco Black-on-white
¶ 217 Chaco Black-on-white is stylistically similar to Gallup Black-on-white, with design elements invariably filled with diagonal hachure. The primary method for differentiating Chaco from Gallup Black-on-white was based on the fineness of the hachure and the contrast in line width between framing lines and hachure. Chaco Black-on-white tends to have thinner, more closely spaced hachure where the width of the framing lines is greater than hachure lines. Chaco Black-on-white surfaces are lightly slipped and often streaky, but usually are well polished.
Chaco-McElmo Black-on-white
¶ 218 This type is the only carbon-painted type within the Chaco Series of Cibola White Ware. The composite name refers to the stylistic similarity of this type to McElmo Black-on-white. In all respects except paint type, Chaco McElmo Black-on-white is technologically a Cibola White Ware. It is distinguished from true McElmo Black-on-white by its Cibolan paste characteristics and its thin, streaky slip, rather than the thick, often crackled slip of McElmo Black-on-white. As with McElmo Black-on-white, evenly spaced tick marks are frequently found on the rims of bowl sherds. Other frequent design elements are checkerboards, bands of parallel lines, opposed triangles, and stepped frets. Squared rims are also common on Chaco-McElmo, as with its Mesa Verde White Ware equivalent. Design elements are usually solidly filled, occasionally filled with dots, but rarely filled with hachure.
PII-PIII mineral-on-white
¶ 219 This category includes all undiagnostic sherds of Cibola White Ware with mineral paint and the characteristic paste of one of the PII or PIII types (i.e., Red Mesa, Escavada, Puerco, Gallup, or Chaco Black-on-white). It may therefore include any of the Cibola White Ware types except Chaco-McElmo Black-on-white, La Plata Black-on-white, or White Mound Black-on-white. The most frequent uses of this category were in the cases where either the size of the sherd was too small to determine which design style was present, or the surface was highly eroded but indicated that mineral paint had been used.
Unidentified Cibola White Ware
¶ 220 Completely unidentifiable Cibola White Ware sherds were placed in this category. These sherds were devoid of paint or were so highly eroded that even paint type could not be determined. Characteristics of the paste were relied upon to identify the sherds as Cibola White Ware. Since the pastes of the two types in the general category of BMIII-PI mineral-on-white are often distinguishable from the later types of Cibola White Ware on the basis of the more coarse, prevalent sand temper of the former, the general category of unidentified Cibola White Ware was occasionally subdivided into two categories: general unidentified Cibola White Ware and BMIII-PI unidentified Cibola White Ware.
Chuska White Ware
¶ 221 Chuska White Ware was distinguished on the basis of one very easily identified attribute: a crushed rock temper, commonly called trachyte or sanidine basalt. The Chuska White Ware types were originally separated and described by Peckham and Wilson (n.d.), and as originally defined, include both a carbon-painted and a mineral-painted series. Most of the Chuska White Ware recorded on the present project was of the carbon-painted series, although some trachyte-tempered sherds decorated with mineral paint were also recorded. Except for the category of Chuska BMIII-PI mineral-on-white, all other mineral-painted sherds with trachyte temper were recorded under the Cibola White Ware stylistic equivalent and the presence of obvious trachyte temper was noted on the form to differentiate these sherds from the Cibola White Ware type. Observation of trachyte mineral-on-white types was unsystematic inasmuch as white ware pastes were not consistently examined. Consequently, the recording of trachyte mineral-on-white other than BMIII-PI varieties may not be quantitatively compared from site to site. The following brief descriptions treat the carbon-painted series more extensively. For further, published descriptions of the various Chuska White Ware types, the reader is referred to Windes (1977) and the comments in response to Windes by Peckham (1977).
Chuska BMIII-PI Mineral-on-white
¶ 222 Mineral-painted sherds with trachyte temper were rarely encountered during the survey. Trachyte grain size in the early BMIII-PI types tends to be very coarse and therefore distinctive in buff pastes, making field identification of the early decorated wares more reliable as opposed to the variable and more finely processed pastes of the later Chuska White Ware types. If sherds with these two attributes were found and had designs indicative of the BMIII-PI stylistic horizon, they were recorded as Chuska BMIII-PI mineral-on-white. This category overlaps in part with what has been called Drolet Black-on-white (Wilson and Peckham n.d.; Windes 1977).
Chuska BMIII-PI Carbon-on-white
¶ 223 This category was occasionally added to the form to tabulate sherds with carbon-painted BMIII and PI designs occurring on sherds with trachyte temper. It is stylistically similar to the category of BMIII-PI mineral-on-white sherds (without trachyte temper).
Tunicha Black-on-white
¶ 224 Tunicha Black-on-white was differentiated from other types of Chuska White Ware by the presence of a Kana’a style of design executed in carbon paint. This design style is essentially the same as that recorded on Early Red Mesa Cibola White Ware sherds during the Chaco Center Rough Sort of excavated ceramics. Parallel, nested, fine lines executed in a continuous band around the interiors of bowls and the exteriors of jars are commonly found. Chevrons, often with intentionally crossed lines at the tips, are more common within this design style than are scrolls and pendant dots, although these elements may also be present.
Chuska Red Mesa Design
¶ 225 This category refers to the carbon-painted Chuska types of Burnham and Newcomb Black-on-white. As the name of the category suggests, it has the same design styles found on Red Mesa Black-on-white (Late Red Mesa in the Chaco Center Rough Sort of excavated ceramics). In contrast to the designs found on Tunicha Black-on-white, the designs of Newcomb Black-on-white tend to be more bold, with fewer fine lines and more solidly filled design elements. Scrolls, opposed and unopposed triangles, and pendant dots are all commonly found within this design style.
Chuska Black-on-white
¶ 226 This type is the carbon-painted Chuska equivalent to Gallup Black-on-white. It is therefore easily differentiated based on the presence of straight-line hachure used as filler in a number of different design elements including parallel bands, opposed triangles, and stepped frets.
Toadlena Black-on-white
¶ 227 If the same designs as found on Escavada Black-on-white are executed in carbon paint on sherds with trachyte temper, they were called Toadlena Black-on-white. The designs are solidly filled and more bold than the designs found on Newcomb Black-on-white, with fewer scrolls and no pendant dots.
Crumbled House Black-on-White
¶ 228 Carbon-painted sherds with trachyte temper executed in the same design style as found on Mesa Verde Black-on-white were recorded as Crumbled House Black-on-white. Because of difficulties in distinguishing the preceding Nava Black-on-white from Crumbled House Black-on-white, the former was not included in the field classification. Crumbled House Black-on-white therefore includes sherds which might otherwise be classified as Nava Black-on-white.
¶ 229 Sherds classified as Crumbled House Black-on-white were distinguished from Mesa Verde Black-on-white by the presence of trachyte temper and the absence of the distinctive crackled slip of the Mesa Verde type. Designs found on Crumbled House Black-on-white are also generally cruder than those found on Mesa Verde Black-on-white, but include the same emphasis on more negative designs than found on earlier types of white wares. Solid bands (especially below the rims of bowls), stepped frets, cross-hatching, interlocking scrolls, and triangles are common among the design elements found on sherds classified as Crumbled House Black-on-white.
Chuska Carbon-on-white
¶ 230 This category was used when sherds could not be placed in one of the above Chuska White Ware types with certainty. Two attributes were necessary for placement in this class: trachyte temper and some vestiges of carbon paint. Since the sherds placed in this category may be from vessels of any of the Chuska White Ware types described above, this category ranges widely in its temporal span.
Unidentified Chuska White Ware
¶ 231 In the cases where white ware sherds had trachyte temper but no evidence of any paint, they were placed in this category. Since there are two possible paint types on Chuska White Ware—carbon and mineral—this category potentially contains sherds coming from either the carbon or mineral series of Chuska White Ware.
Tusayan White Ware
¶ 232 The Tusayan White Ware types are distinguishable from other white ware types by the presence of sand temper to the exclusion of all other tempering materials. In addition, designs on Tusayan White Ware are executed in carbon paint. The following summaries of the types of Tusayan White Ware recorded during the inventory survey are based primarily on descriptions by Colton (1955).
BMIII-PI Carbon-on-white
¶ 233 This category includes the two earliest types of Tusayan White Ware: Lino Black-on-gray and Kana’a Black-on-white. Although these two types were not specified on the form, the ceramic recorders often noted which one of the two types were present. Based on surface treatment alone, this general category is most easily confused with Chuska BMIII-PI carbon-on-white sherds. The distinctive tempering materials were used to identify Tusayan versus Chuska sherds. In contrast to later types of Tusayan White Ware, BMIII-PI carbon-on-white sherds have coarse temper (often protruding through the surface), are frequently unslipped, and have cruder designs.
¶ 234 Lino Black-on-gray has an unslipped surface which may often be pitted and bumpy. The black, carbon paint is used to produce very simple designs including fringed, ticked, or plain narrow lines; rows of small dots; and parallel bands. Kana’a Black-on-white has a better finished surface than Lino Black-on-gray, resulting from the more frequent use of slip and polish. Kana’a designs use fine, parallel lines in continuous band patterns (often with intentional overlap at line junctures); solid triangles (sometimes with hooks or pendant dots); and dotted or ticked straight lines.
Sosi-Black Mesa Black-on-white
¶ 235 These two types of Tusayan White Ware were combined on the ceramic recording form because of frequent problems in differentiating one from the other. If the ceramic recorder was sufficiently confident in identifying one of these types, the individual type name was noted on the form. Both have fine to medium textured sand temper, white slip, and carbon paint. The primary means of differentiating Black Mesa Black-on-white from Sosi Black-on-white is design style. Black Mesa Black-on-white has designs reminiscent of Red Mesa Black-on-white: wide parallel bands; triangles, with and without pendant dots; rows of open diamonds; and, occasionally, interlocking scrolls. Sosi Black-on-white designs are similar, but generally more boldly executed with more areas of solidly filled designs. The design elements common on this type include triangles, stepped frets, horizontal stripes, and pendant barbs rather than the dots found on Black Mesa Black-on-white.
Tusayan Carbon-on-white
¶ 236 This general category was used in the event that a sherd had fine to medium sand temper and carbon paint, but not enough of the design style to accurately assign the sherd to one of the Tusayan White Ware types. It may include any of the types in this ware such as Black Mesa, Sosi, Dogoszhi, or Flagstaff Black-on-whites, although the latter two types are rarely encountered in Chaco area assemblages.
Mesa Verde White Ware
¶ 237 Mesa Verde White Ware is usually distinguished from other White Wares by the presence of crushed rock temper, although sherd temper is often used in the western area of its distribution. Because the crushed rock temper is often difficult to differentiate from well-processed sherd temper in the field and because of the occasional use of sherd temper, Mesa Verde White Ware may potentially be confused with Cibola White Ware. In these cases, surface treatment may also be relied on for differentiating the two wares. Early Mesa Verde White Ware has no slip, whereas the contemporaneous Cibola White Ware types usually have slip present on at least one surface. Later Mesa Verde White Ware generally has a thicker, more well-polished slip than contemporaneous Cibola White Ware with crazing of the surface much more frequent. The differentiation of individual types of Mesa Verde White Ware was based on the descriptions of Breternitz et al. (1974).
Mancos-Cortez Black-on-white
¶ 238 These two types were combined on the ceramic recording form, but as with Black Mesa and Sosi Black-on-whites, if the ceramic recorder was confident in their identification, the individual type names were noted. Both Mancos and Cortez Black-on-whites have mineral paint and are therefore easily differentiated from the later carbon-painted types of Mesa Verde White Ware. Mancos and Cortez Black-on-whites are differentiated from earlier, mineral-painted Mesa Verde White Ware types on the basis of design style. Cortez Black-on-white most resembles Red Mesa Black-on-white in design treatment. Triangles with pendant dots; interlocking scrolls; parallel, straight lines; and squiggled lines are the most common design elements found on this type. Mancos Black-on-white typically has designs commonly found on the Cibola White Ware types of Red Mesa, Escavada, and Gallup Black-on-whites. These designs include opposed and unopposed triangles, interlocking scrolls, bands of parallel or oblique hachure, checkerboards, pendant or free-standing dots, and parallel lines. The dates for Cortez Black-on-white are A.D. 900 to 1000 (and possibly later), while the dates for Mancos Black-on-white are A.D. 900 to 1150. Thus, for the purposes of chronological control, if Cortez can be definitely identified, the timespan is shorter than if Mancos Black-on-white or the composite designation is used.
McElmo Black-on-white
¶ 239 In contrast to the previous two types in the series of Mesa Verde White Ware, McElmo Black-on-white is decorated with carbon rather than mineral paint. The slip tends to be better polished than preceding types of Mesa Verde White Ware. This attribute was also used to differentiate McElmo Black-on-white from contemporaneous white ware types, especially in those cases where the crushed rock temper was mixed with other temper types such as sand or crushed sherds. The designs on this type are often similar to that of Mancos Black-on-white, being composed of stepped frets, triangles, checkerboards, and straight lines in horizontal or vertical bands. But as noted above, Mancos and McElmo Black-on-whites may be easily distinguished based on paint type. Both solidly filled and hachured elements may be used.
Mesa Verde Black-on-white
¶ 240 As with the previous type, Mesa Verde Black-on-white also has carbon-painted designs. Because of this similarity, as well as the use of design elements similar to McElmo Black-on-white, Mesa Verde Black-on-white may be more easily confused with this type than any other. On the Chaco survey, the main criterion used to differentiate the two types was the negativity of the design, although the quality of design execution was also a factor. Mesa Verde Black-on-white tends to have more use of black paint relative to the total surface area and also has more finely painted designs than does McElmo Black-on-white. Differentiation of the two is usually clear in the case of a large sized sherd.
Unidentified Mesa Verde Carbon-on-white
¶ 241 In those cases where the designation of either McElmo or Mesa Verde Black-on-white could not be made with confidence, sherds were tabulated within this category. As noted above, large sized sherds were more easily assigned than small ones. The category of unidentified Mesa Verde carbon-on-white therefore contains a large percentage of small sized sherds. Although the dates for these two types overlap, the effect of using this category instead of one of the individual type names is slightly less precise chronological control.
White Mountain Red Ware
¶ 242 White Mountain Red Ware was the most commonly encountered red ware during the inventory survey, although the occurrence of any of the redwares was infrequent. This red ware is distinguished from the other red wares by its surface treatment, paint type, paste, and design treatment. White Mountain Red Ware has a distinctive, thick, well-polished slip, ranging in color from maroon through orange. The paste may be gray, buff, or occasionally brown. The descriptions of the types of White Mountain Red Ware types presented by Carlson (1970) were used for identifications in the field. Only the chronologically early White Mountain Red Ware types are described below, because the later types post-date the span of prehistoric occupation of the Chaco area and were not present in the assemblages of sites recorded.
Puerco Black-on-red
¶ 243 Puerco Black-on-red is distinguishable from later White Mountain Red Ware types on the basis of design style, and less reliably, on slip color. The designs present on Puerco Black-on-red are generally those of the Holbrook and Puerco design styles. The designs used to differentiate this type of White Mountain Red Ware from the others include the use of solidly filled elements of triangles, frequently with barbs or pendant dots; interlocking scrolls; checkerboards; and solid bands. If hachure is present, it is parallel to the framing lines and never oblique. The slip color tends to be a medium to pinkish red which may often appear chalky or powdery. Small sherds of Wingate Black-on-red with solid and hatched designs may be confused with Puerco Black-on-red if only the solid filled areas are present.
Wingate Black-on-red
¶ 244 The designs most common on this type are those of the Wingate or Reserve design styles. Within these stylistic traditions, design elements are often filled with hachure. In contrast to the hachure found on Puerco Black-on-red vessels, the hachure found on Wingate Black-on-red is almost always oriented obliquely to the framing lines. Hatched areas are frequently opposed to solidly filled areas in designs most often consisting of opposed triangles and interlocking scrolls. In the case of opposed solid and hatched elements, hatched areas are usually larger than solidly filled areas. Slip color is usually (but not always) a good indicator of this type. In many cases it is a deep, maroon color.
Wingate Polychrome
¶ 245 Wingate Polychrome is essentially the same as Wingate Black-on-red, but with the addition of one and sometimes two other paint colors. The main designs are still executed in black paint, but on the exteriors of bowls (jars are very rare within Wingate Polychrome), white or red paint may be used in broad, continuous and often overlapping areas. Particularly in those cases where red paint is used, the exteriors of bowls may be left unslipped, or may be slipped all over with white.
St. Johns Black-on-red
¶ 246 St. Johns Black-on-red is most easily confused with Wingate Black-on-red. Two main criteria were used in the field to differentiate these two types. First, St. Johns Black-on-red tends to have a more orange or orange-red slip instead of the maroon slip most often found on Wingate Black-on-red. Second, the designs used on St. Johns vessels are usually executed in the Tularosa style, rather than Wingate or Reserve styles. The Tularosa style includes finer line work, with more lines per centimeter in hatched areas and an emphasis on curvilinear designs. Another differentiating criteria between Wingate and St. Johns Black-on-reds is that on the latter, hachure may be either parallel or oblique instead of just obliquely oriented. In addition, opposed solid and hatched areas are the same size on St. Johns vessels, rather than hatched elements covering more space than solid elements.
St. Johns Polychrome
¶ 247 The addition of white on the exterior of bowls or jars otherwise classifiable as St. Johns Black-on-red was used to differentiate St. Johns Polychrome. In addition, white outlining of the black-on-red designs on the interior of bowls may also be present. The use of white on the exterior of bowls is rarely as broadly executed as on Wingate Polychrome vessels providing another criterion besides slip color and design style for differentiating this type from St. Johns Polychrome.
Unidentified White Mountain Red Ware
¶ 248 If paste and slip characteristics indicated that a sherd was a White Mountain Red Ware, but not enough of the design was present to diagnose which type within this red ware series, the sherd was tabulated as unidentified White Mountain Red Ware. Since the two polychromes are easily distinguished, even in the case of small sherds, the unidentified category consists primarily of black-on-red types.
San Juan Red Ware
¶ 249 San Juan Red Ware was rarely encountered and was usually tabulated only by ware. In some cases, however, the ceramic recorders noted the typological designation next to the tabulations of this ware. These red ware vessels may be decorated in either black or red paint. San Juan Red Ware types with black paint include Bluff, La Plata, Deadman’s, and Middleton Black-on-reds. Abajo Red-on-orange is the only type decorated with red paint. One polychrome type is also present within this series, Abajo Polychrome, decorated with both red and black on the usually unslipped red surface. These types have been well described by Breternitz et al. (1974) and Colton (1956). San Juan Red Ware was differentiated from White Mountain Red Ware by the presence of quartz and crushed rock temper rather than crushed sherd temper and by the red color of the paste instead of the gray, buff, or brown of the White Mountain Red Wares. In addition, most San Juan Red Ware sherds are unslipped (La Plata Black-on-red is the main exception). San Juan Red Ware was distinguished from Tsegi Orange Ware by the color and composition of the paste as well as surface treatment. The former does not have sherd temper, has a red rather than orange paste color, and is less frequently slipped. Trachyte-tempered specimens (Sanostee Red-on-orange) were also occasionally noted in the field.
Tsegi Orange Ware
¶ 250 As noted above, Tsegi Orange Ware is usually tempered with crushed sherds, although quartz sand may often be found mixed with the sherd temper. Paste color is another distinguishing criterion: as the name implies, the pastes of Tsegi Orange Ware tend to be orange. The surfaces of types of this ware may be slipped or unslipped, but are always well polished and often crazed. Two black-on-red types (Medicine and Tusayan Black-on-reds) and three polychrome types (Cameron, Citadel, and Tusayan Polychromes) are present within this red ware series (Colton 1956). While the polychrome types were separated in the field, the two black-on-red types were not. Instead, the two bichromes were both classified simply as Tsegi Orange Ware. Since some undiagnostic sherds coming from polychrome vessels were undoubtedly classified within the general category of Tsegi Orange Ware, the equivalence of totals for this general category cannot be taken as the totals for just Medicine and Tusayan Black-on-reds. The design criteria used for separating the three polychrome types are outlined below.
Cameron Polychrome
¶ 251 This Tsegi Orange Ware type is decorated with black hachure and wide bands of red. The areas of hachure may be either between or superimposed on the red bands.
Citadel Polychrome
¶ 252 This type of Tsegi Orange Ware is usually slipped, except for an area just under the rim. The presence of an exterior slip on bowl sherds was used to differentiate this type from the preceding Cameron Polychrome. As with Cameron Polychrome, the designs are painted in black and red. When hachure is present on Citadel Polychrome vessels, it is not superimposed on the areas painted red. Black paint is often used to outline horizontal or diagonal red bands.
Tusayan Polychrome
¶ 253 In contrast to the preceding type, Tusayan Polychrome is unslipped on the exterior of bowls. In terms of surface treatment, it is therefore more easily confused with Cameron Polychrome. The infrequent use and placement of black hatched areas was used to distinguish Tusayan from Cameron Polychrome. While broad bands of red are present on both types, the use of black paint on Tusayan Polychrome is primarily limited to the outlining of designs painted in red. Where hachure is present, it is not superimposed on the red areas, but used between them.
Miscellaneous Prehistoric Wares
¶ 254 Other prehistoric types not described above were rarely encountered. These included wares from outside of the Chaco area, including those whose distributions are primarily within the Mogollon area.
Smudged Brown Ware
¶ 255 This very general category included all sherds of Mogollon brownware with smudged interiors. Plain, clapboard corrugated, and indented corrugated surfaces were not differentiated. The analytical utility of this category is therefore primarily for the comparison of sherds of local vs. non-local manufacture, and has little chronological utility.
Socorro Black-on-white
¶ 256 This white ware type is another ceramic type whose distribution is primarily to the south of the Chaco area. Although it has a white slip and designs similar to types of Cibola White Ware, it is easily distinguishable on the basis of its paste. The paste of Socorro Black-on-white is a very fine-grained gray containing numerous small fragments of black, crushed igneous rock, in addition to fine particles of quartz sand (Human Systems Research 1973).
Navajo Plain Ware
¶ 257 Following Brugge’s (1981) descriptions of Navajo pottery, three different Navajo plain ware types were recognized. All of these plain ware types usually have gray to black, but occasionally brown or red pastes. Jars are the predominant vessel form. Both the interior and exterior surfaces are roughly finished, with the exterior surfaces usually exhibiting clear striations, the result of having been scraped with corn cobs. Decoration is infrequent except for the area around the neck. Variation in the kind of decoration used was the primary means of differentiating among the three types when this portion of the vessel was present. The predominant temper type is sand for the earliest type, but Brugge notes a tendency for sherd temper to be used in the latter two types. In addition to sand and sherd tempers, micaceous temper may be present within any of the three plain ware types. Brugge has suggested that this may represent spatial variability in the area of manufacture, and not necessarily temporal variation. The ceramic recorders on the present project occasionally noted the presence of mica temper, but the recording of this attribute was not formalized.
Dinetah Gray
¶ 258 Dinetah Gray is the earliest of the Navajo plain ware types and the most ubiquitous during the inventory survey. The wall thickness of this type is usually less than the succeeding two plain ware types. Decoration is rare, but when present is restricted to incising around the neck area. Sand temper predominates within this type ant temper grains may often protrude through the vessel surface.
Navajo Gray
¶ 259 Navajo Gray tends to have slightly thicker vessel walls and to contain less sand and more sherd temper than Dinetah Gray. An additional diagnostic is the presence of appliqued rather than incised decoration. These appliques usually consist of single, double, or triple fillets wrapped around the full circumference of the neck.
Pinyon Gray
¶ 260 Pinyon Gray has essentially the same paste composition and surface treatment as Navajo Gray. The only differentiating criterion is the decorative treatment of the neck area. Therefore, the only sherds which were identified as Navajo versus Pinyon Gray are those which represent this portion of the vessel. In contrast to Navajo Gray, the fillets on Pinyon Gray are molded rather than appliqued. This type was rarely encountered during the inventory survey.
Navajo Painted Ware
¶ 261 Two types of Navajo painted ware were differentiated in the field. In both cases, bowls are the predominant form, but there appears to be more variability in the forms of Navajo painted types than among the Navajo plain ware. Tempering materials are usually a mixture of aplastics, including sherd, sand, and occasionally crushed sandstone. Brugge (1981) notes that sand is rarely used alone, in contrast to the plain ware. Variation in the painted design was the primary means of differentiating between the two painted types described below, although paste color was also used, especially in those cases where design criteria were ambiguous.
Gobernador Polychrome
¶ 262 This type was manufactured during the period when many Puebloan traits were being incorporated into Navajo material culture. The production of Gobernador Polychrome is one example. This ceramic type shows clear stylistic and formal relationships to contemporaneous Pueblo pottery types, particularly those manufactured in the Acoma, Zuni, and Zia areas (e.g., Ako, Ashiwi, and Puname Polychromes). The designs on Gobernador Polychrome are usually executed in matte red, black, and occasionally white paint on buff or orange surfaces. The surfaces are unslipped, but polished. The design elements used include stepped frets, stylized feathers, triangles, and medallions. Besides design treatment, one of the diagnostics of this type is the presence of a gray paste, except for areas closest to the surface which may be buff or orange.
Navajo Painted
¶ 263 In contrast to the preceding type, the designs painted on this type are more crudely executed with bichromes more common than polychromes. Brugge (1981) notes that the polychrome examples of Navajo Painted are probably earlier than the bichromes. Matte red and black paints are used on the unslipped buff or orange surface. The black paint usually contains some mineral pigment, but occasionally may be only an organic medium. In contrast to the previous type, the paste of Navajo Painted tends to be buff throughout, not just near the surface. As noted above, the designs are more crude, consisting of broad lines, large solidly filled elements, and pictorials. Paste color and the simplicity of design were the main criteria used for separating this type from Gobernador Polychrome.
Historic Pueblo Wares
¶ 264 Historic Pueblo wares were distinguished from Navajo painted ware by the presence of a slip, which in most cases produced a white surface color. In addition, temper and design variability served to differentiate the historic Puebloan wares both from the Navajo painted ware as well as from each other. In some cases, sherds were only tabulated within the general category of Historic Pueblo ware. But, due to the presence of diagnostic tempering materials, finer distinctions were often made. Three general wares were identified in the field: Keresan, Zuni, and Hopi, although Keresan and Zuni wares were not separated in the computer analysis. The discriminating criteria used to identify each one of these is discussed below.
Keresan
¶ 265 The ceramics of the historic Keresan speaking Pueblos have been subdivided into two groups: the Northeast Keres District and the Puname District (Frank and Harlow 1974; Harlow 1973). Only the ceramics of the Puname District were identified during the present project. Ceramics made in the Puname District, including the Pueblos of Zia and Santa Ana, are distinguished from all other historic Pueblo ceramics by their characteristic pastes. These pastes are of a brick red, light red, or occasionally buff color with either basalt (Zia) or sand (Santa Ana) temper. The designs on Puname District ceramics are executed in black and red matte paints on a white slipped surface, with areas of red generally greater than on contemporaneous types of other pueblos. Of the several Puname area types described by Frank and Harlow (1974; Harlow 1973), only Zia Polychrome and Santa Ana Polychrome, were identified. The basis for distinguishing these two types are described below. Sometimes the general category of “unidentified Keresan polychrome” was also recorded. In most of these cases, the distinctive Zia area temper was present, but a positive identification as Zia Polychrome could not be made.
Zia Polychrome
¶ 266 The distinctive black, crushed basalt temper in a brick red paste was used to differentiate this type. While Zia types earlier than Zia Polychrome also contain this temper, design treatment generally indicated the ceramics encountered on the present survey could be classified as Zia Polychrome. It is possible, however, that a few sherds of the preceding Zia type of Trios Polychrome were also included within this category. Thus, the time span of ca. 1800 to the present is best used for the category of “Zia Polychrome,” as used during the present project.
Santa Ana Polychrome
¶ 267 Although the fired paste color is very similar to that found within vessels made at Zia, the temper used at Santa Ana was sand, rather than crushed basaltic rock. This was the primary criterion used to identify Santa Ana Polychrome vessels.
Zuni
¶ 268 Historic Zuni ceramics were differentiated on the basis of their buff or gray pastes, sherd temper, and distinctive design elements. In nearly all cases, the sherds were polychromes. If enough of the design was present, the typological assignments of Zuni or Kiapkwa Polychrome were made. The earliest historic matte-paint Zuni type of Ashiwi Polychrome was not identified. With a few exceptions, the descriptions of Frank and Harlow (1974; Harlow 1973) may be followed for the identification and dating of Zuni matte-paint types.
Kiapkwa Polychrome
¶ 269 This type was differentiated from Zuni Polychrome by the presence of one or more of the following attributes: an undercut base, emphasis on finely executed hatched design elements in asymmetrical designs, and red rather than brown painted rims.
Zuni Polychrome
¶ 270 The designs used to differentiate this type include the distinctive feather motif on the exterior of bowls, and the use of the “rainbird” and medallion motifs on the interior of bowls and exterior of jars. In addition, brown rim color and the absence of an undercut base was used to separate this type from the preceding type of Kiapkwa Polychrome. The dates for Zuni Polychrome range from ca. 1850 to the present, but of the examples noted in the field, all probably predate the 1930s, if not 1900.
Hopi
¶ 271 Historic Hopi ceramics were distinguished on the basis of their clear, buff pastes. These pastes tend to be much harder than those found within any contemporaneous Puebloan ceramics. In most cases, the surface color of historic Hopi ceramics is also buff. In at least one case, however, the white slip characteristic of Polacca Polychrome was present. This type was made during the period of 1850 to 1900 when Zuni color and design combinations were widely used at Hopi (Adams 1983). Individual types of historic Hopi ware were not distinguished in the field and the use of this category for chronological distinctions is therefore limited.
Dating
Method of Date Assignment
¶ 272 Estimated beginning and ending dates were assigned to each provenience with ceramics in the field. Dates for each provenience are based on the overlap of dates for individual types present in the assemblage, using the dates shown in Appendix 4.2, Table 1. Since the date assignments made in the field were by three different ceramic recorders, the dates were reevaluated during the analysis stage. This reevaluation was made on the basis of the types noted on the ceramic forms and not by reanalysis of the artifacts themselves because a noncollection policy was used during the fieldwork.
¶ 273 There are several problems with date assignments based on this method. First, the noncollection policy does not allow any means of determining if there are biases in the typological identifications made by the three different field recorders that may have an effect on the estimated dates. Second, the range of dates for any specific ceramic type may be quite long and may not be able to reflect the more limited time spans of actual site occupations. Third, the estimated date ranges, although applicable at a broad, regional level, may not be accurate for specific areas within the region. The method assumes roughly contemporaneous distributions over the region at any one point in time. And finally, biases in dating may be caused by functional differences among sites if these differences are reflected in the proportions of different ceramic types used for dating.
¶ 274 Before the method is rejected as being invalid, however, several points relevant to the current project bear consideration. Although a noncollection policy was used, the three ceramic recorders often consulted on specific identifications and observed each other’s tallying procedures in the field. In addition, the ceramic recording form was designed to combine those ceramic categories which had been shown to be differentially identified from recorder to recorder in the Chaco Project’s laboratory analysis of excavated ceramics. The problem with possible incongruity of actual span and assigned span is a real one, but methods have not been developed to be able to control for this potential source of bias using surface ceramic assemblages.
¶ 275 The potential for intra-regional differences in the dating of various types is lessened somewhat by the numerous excavations which have been conducted in the Chaco Canyon area. These excavations have produced many chronometric dates, providing a basis for assigning date ranges which are more local to the Chaco area. Yet, the possibility remains that even within the small area of Chaco Canyon and its immediate outliers, social factors may be operating to create noncontemporaneous distributions of the same ceramic types.
¶ 276 The specific technique of assigning dates to the sites recorded on the present project, as noted above, was based on the overlap of dates for the ceramic types identified in the field. Sites with small samples were often excluded from this procedure and either given an “unknown” assignment, or, based on the presence of certain types, “post-” or “pre-” designations.
¶ 279 For future research using this data base, a bilevel code for the dates was also assigned. This variable of “datecode” was assigned to each provenience to distinguish proveniences which were dated with relatively greater confidence during the reevaluation stage. A datecode of “1” represents proveniences which were felt to be better dated, while a datecode of “2” was assigned to those proveniences which were not. Most often, an assignment of “2” was made in cases where there were particularly small overall samples, or there were small quantities of diagnostic ceramic types (i.e., painted types). Because sites with small numbers of ceramics and small numbers of painted ceramics could represent functionally distinct site types, judicious use of these “datecodes” is advised. Their usefulness is seen in providing a quick way of sorting proveniences in order to look at a subset of the proveniences with the best dates.
References
| Adams, E. Charles | |||
| 1983 | Native Ceramics Typology from Walpi Pueblo. Pottery Southwest 10(1):1-3. | ||
| Breternitz, David A., Arthur H. Rohn, Jr., and Elizabeth A. Morris | |||
| 1974 | Prehistoric Ceramics of the Mesa Verde Region. Museum of Northern Arizona Ceramic Series No. 5. Flagstaff, Arizona. | ||
| Brugge, David M. | |||
| 1981 | Navajo Pottery and Ethnohistory. Reprinted. Navajo Nation Papers in Anthropology No. 4. Navajo Nation Cultural Resource Management Program, Window Rock, Arizona. Originally published 1963, Navajo Tribal Museum, Window Rock, Arizona. | ||
| Carlson, Roy L. | |||
| 1970 | White Mountain Redware, A Pottery Tradition of East-Central Arizona and Western New Mexico. Anthropological Papers of the University of Arizona Number 19. Tucson. | ||
| Cibola Whiteware Conference | |||
| 1958 | Cibola White Conference. Unpublished ms. on file, Museum of Northern Arizona, Flagstaff, Arizona. | ||
| Colton, Harold S. | |||
| 1941 | Winona and Ridge Ruin, Part II, Notes on the Technology and Taxonomy of the Pottery. Museum of Northern Arizona Bulletin No. 19. Flagstaff, Arizona. | ||
| ---- | |||
| 1955 | Pottery Types of the Southwest. Museum of Northern Arizona Ceramic Series No. 3A. Flagstaff, Arizona. | ||
| ---- | |||
| 1956 | Pottery Types of the Southwest, Wares 5A, 5B, 6A, 7A, 7B, 7C, San Juan Red Ware, Tsegi Orange Ware, Homolovi Orange Ware, Winslow Orange Ware, Awatovi Yellow Ware, Jeddito Yellow Ware, Sichomovi Red Ware. Museum of Northern Arizona Ceramic Series No. 3C. Flagstaff, Arizona. | ||
| Colton, Harold S., and Lyndon L. Hargrave | |||
| 1937 | Handbook of Northern Arizona Pottery Wares. Museum of Northern Arizona Bulletin 11. Northern Arizona Society of Science and Art, Flagstaff, Arizona. | ||
| Dykeman, Douglas D., James K. Feathers, and Ronald H. Towner | |||
| 2003 | Tree Rings and Thermoluminescence: Chronology and Dating Issues of the Early Navajo Occupation. In The Morris Site 1 Early Navajo Land Use Study: Gobernador Phase Community Development in Northwestern New Mexico, Volume 2, edited by Douglas D. Dykeman, pp. 373-390. Navajo Nation Papers in Anthropology No. 39, Window Rock, Arizona. | ||
| Frank, Larry, and Francis H. Harlow | |||
| 1974 | Historic Pottery of the Pueblo Indians, 1600-1880. New York Graphic Society, Boston. | ||
| Harlow, Francis H. | |||
| 1973 | Matte-Paint Pottery of the Tewa, Keres, and Zuni Pueblos. Museum of New Mexico Press, Santa Fe. | ||
| Human Systems Research, Inc. | |||
| 1973 | Technical Manual. Human Systems Research, Tularosa, New Mexico. | ||
| Loose, Richard W. | |||
| 1977 | Petrographic Notes on Selected Lithic and Ceramic Materials. In Settlement and Subsistence Along the Lower Chaco River: The CGP Survey, edited by Charles A. Reher, pp. 567-571. University of New Mexico Press, Albuquerque. | ||
| McKenna, Peter J. | |||
| 1981 | The Distribution of Chaco Canyon’s Survey Ceramics. Unpublished ms. on file, Chaco Culture National Historical Park Museum Archive, University of New Mexico, Albuquerque. | ||
| McKenna, Peter J., and H. Wolcott Toll | |||
| 1984 | Ceramics. In The Architecture and Material Culture of 29SJ 1360 by Peter J. McKenna, pp. 103-222. Reports of the Chaco Center, Number 7. Division of Cultural Research, National Park Service, Albuquerque. | ||
| Peckham, Stewart | |||
| 1977 | Comments on the Chuska Ceramic Series. In Settlement and Subsistence Along the Lower Chaco River: The CGP Survey, edited by Charles A. Reher, p. 358. University of New Mexico Press, Albuquerque | ||
| Peckham, Stewart, and John Wilson | |||
| n.d. | Chuska Valley Ceramics. Unpublished ms. on file, Laboratory of Anthropology, Museum of New Mexico, Santa Fe. | ||
| Powers, Robert P. | |||
| 1983 | Research Design for Continuation of Field Studies. Unpublished ms. on file, Chaco Culture National Historical Park Museum Archive, University of New Mexico, Albuquerque. | ||
| Roberts, Frank H. H., Jr. | |||
| 1927 | The Ceramic Sequence in Chaco Canyon, New Mexico, and Its Relation to the Cultures of the San Juan Basin. Unpublished Ph.D. dissertation, Department of Anthropology, Harvard University, Cambridge, Massachusetts. | ||
| Sullivan, Alan P., and Jeffrey L. Hantman (Editors) | |||
| 1984 | Regional Analysis of Prehistoric Ceramic Variation: Contemporary Studies of the Cibola Whitewares. Arizona State University Anthropological Research Papers No. 31. Tempe, Arizona. | ||
| Toll, H. Wolcott and Peter J. McKenna | |||
| 1981 | Ceramics of 628. Unpublished ms. on file, Chaco Culture National Historical Park Museum Archive, University of New Mexico, Albuquerque. | ||
| ---- | |||
| 1987 | The Ceramography of Pueblo Alto. In Investigations at the Pueblo Alto Complex, Chaco Canyon, New Mexico, 1975-1979. Volume III, Part 1. Artifactual and Biological Analyses, edited by Frances Joan Mathien and Thomas C. Windes, pp. 19-230. Publications in Archeology 18F, Chaco Canyon Studies. National Park Service, Santa Fe. | ||
| ---- | |||
| 1992 | The Rhetoric and the Ceramics: Discussion of Types, Functions, and Sources of the Ceramics of 29SJ 627. In Excavations at 29SJ 627, Chaco Canyon, New Mexico. Volume II. The Artifact Analyses, edited by Frances Joan Mathien, pp. 37-248. Reports of the Chaco Center, Number 11. National Park Service, Santa Fe. | ||
| ---- | |||
| 1993 | The Testimony of the Spadefoot Ceramics. In The Spadefoot Toad Site: Investigations at 29SJ 629, Chaco Canyon, New Mexico: Artifactual and Biological Analyses. Volume II, edited by Thomas C. Windes, pp. 15-134. Reports of the Chaco Center, No. 12. National Park Service, Santa Fe. | ||
| ---- | |||
| 1997 | Chaco Ceramics. In Ceramics, Lithics, and Ornaments of Chaco Canyon. Analyses of Artifacts from the Chaco Project 1971-1978. Volume I. Ceramics, edited by Frances Joan Mathien, pp. 17-530. Publications in Archeology 18G, Chaco Canyon Studies. National Park Service, Santa Fe. | ||
| Toll, H. Wolcott, Thomas C. Windes, and Peter J. McKenna | |||
| 1980 | Late Ceramic Patterns in Chaco Canyon: The Pragmatics of Modeling Ceramic Exchange. In Models and Methods in Regional Exchange, edited by Robert E. Fry, pp 95-117. SAA Papers 1. | ||
| Windes, Thomas C. | |||
| 1977 | Typology and Technology of Anasazi Ceramics. In Settlement and Subsistence Along the Lower Chaco River: The CGP Survey, edited by Charles A. Reher, pp. 269-370. University of New Mexico Press, Albuquerque. | ||
| ---- | |||
| 1984 | A View of the Cibola Whitewares from Chaco Canyon. In Regional Analysis of Prehistoric Ceramic Variation: Contemporary Studies of the Cibola Whitewares, edited by Alan P. Sullivan and Jeffrey L. Hantman, pp. 94-119. Arizona State University Anthropological Research Papers No. 31. Tempe, AZ. | ||